| Red | Green | Blue | |
| z | 17.64 | ||
| znorm | Inf | ||
| sky | -Inf | -Inf | -NaN |
| S/N | 14.6 | 26.3 | 28.9 |
| S/N(c) | 0.0 | 0.0 | 0.0 |
| SN(E/C) |
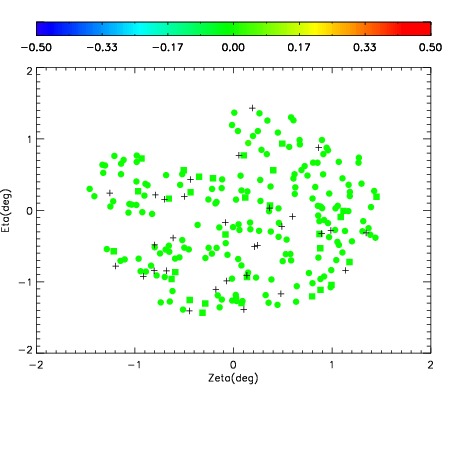
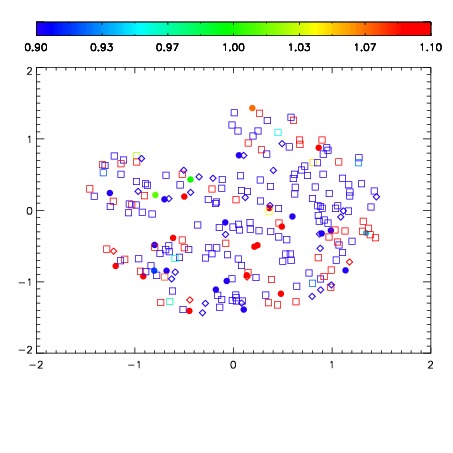
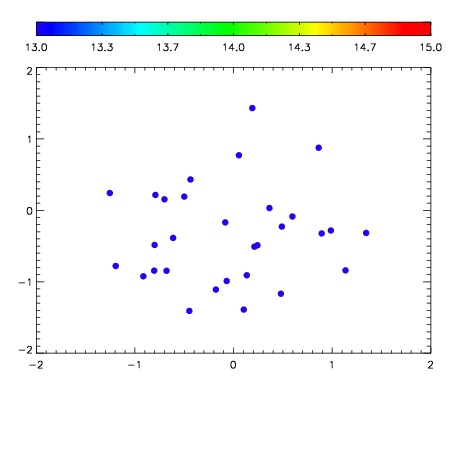

| Frame | Nreads | Zeropoints | Mag plots | Spatial mag deviation | Spatial sky 16325A emission deviations (filled: sky, open: star) | Spatial sky continuum emission | Spatial sky telluric CO2 absorption deviations (filled: H < 10) | |||||||||||||||||||||||
| 0 | 0 |
|
|
|
|
|
|
| IPAIR | NAME | SHIFT | NEWSHIFT | S/N | NAME | SHIFT | NEWSHIFT | S/N |
| 0 | 16290013 | 0.491531 | 0.00000 | 17.8505 | 16290014 | -0.000414731 | 0.491946 | 17.9938 |
| 1 | 16290016 | 0.490721 | 0.000810027 | 18.6773 | 16290015 | -0.000564518 | 0.492096 | 18.2640 |
| 2 | 16290012 | 0.490362 | 0.00116903 | 17.7213 | 16290011 | 0.00000 | 0.491531 | 17.7483 |