| Red | Green | Blue | |
| z | 17.64 | ||
| znorm | Inf | ||
| sky | -Inf | -Inf | -NaN |
| S/N | 16.9 | 34.7 | 36.6 |
| S/N(c) | 0.0 | 0.0 | 0.0 |
| SN(E/C) |
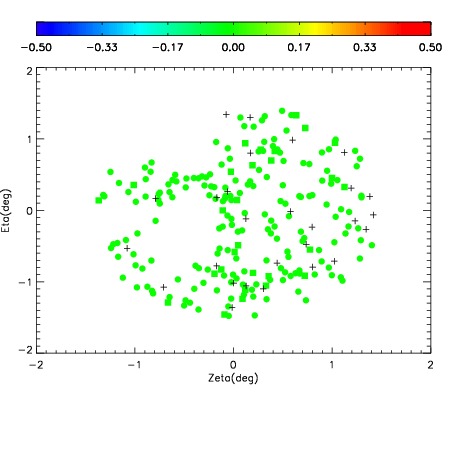
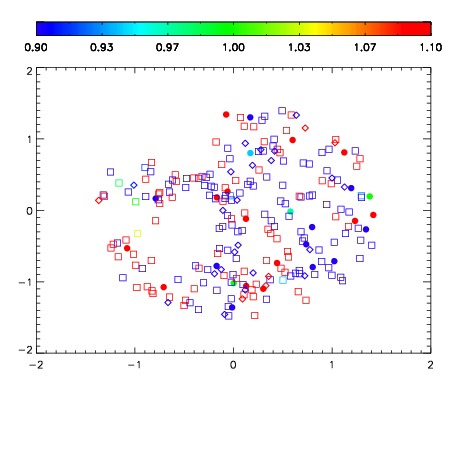


| Frame | Nreads | Zeropoints | Mag plots | Spatial mag deviation | Spatial sky 16325A emission deviations (filled: sky, open: star) | Spatial sky continuum emission | Spatial sky telluric CO2 absorption deviations (filled: H < 10) | |||||||||||||||||||||||
| 0 | 0 |
|
|
|
|
|
|
| IPAIR | NAME | SHIFT | NEWSHIFT | S/N | NAME | SHIFT | NEWSHIFT | S/N |
| 0 | 16240029 | 0.00213930 | 0.00000 | 18.3509 | 16240031 | -0.485228 | 0.487367 | 18.3930 |
| 1 | 16240030 | 0.00133850 | 0.000800800 | 18.3311 | 16240028 | -0.485095 | 0.487234 | 18.2776 |
| 2 | 16240022 | 0.00000 | 0.00213930 | 18.2853 | 16240023 | -0.486875 | 0.489014 | 18.1776 |
| 3 | 16240026 | 0.00195812 | 0.000181180 | 18.0888 | 16240024 | -0.485991 | 0.488130 | 17.9964 |
| 4 | 16240025 | 0.00188738 | 0.000251920 | 17.9920 | 16240027 | -0.485604 | 0.487743 | 17.9489 |
| 5 | 16240033 | 0.00161911 | 0.000520190 | 17.9282 | 16240032 | -0.485661 | 0.487800 | 17.9407 |