| Red | Green | Blue | |
| z | 17.64 | ||
| znorm | Inf | ||
| sky | -Inf | -Inf | -Inf |
| S/N | 4.9 | 10.6 | 11.4 |
| S/N(c) | 0.0 | 0.0 | 0.0 |
| SN(E/C) |
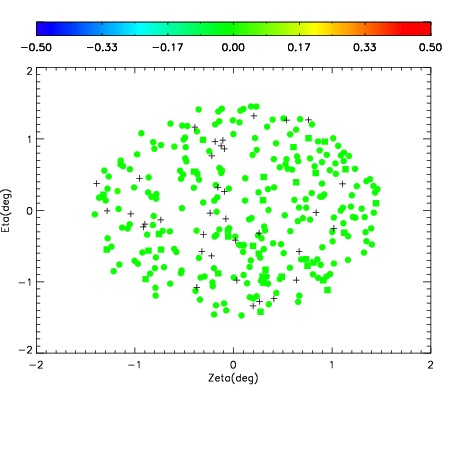
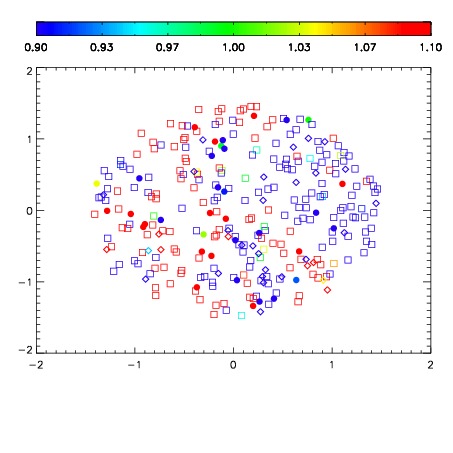


| Frame | Nreads | Zeropoints | Mag plots | Spatial mag deviation | Spatial sky 16325A emission deviations (filled: sky, open: star) | Spatial sky continuum emission | Spatial sky telluric CO2 absorption deviations (filled: H < 10) | |||||||||||||||||||||||
| 0 | 0 |
|
|
|
|
|
|
| IPAIR | NAME | SHIFT | NEWSHIFT | S/N | NAME | SHIFT | NEWSHIFT | S/N |
| 0 | 16010017 | 0.491660 | 0.00000 | 16.3235 | 16010014 | 0.00257141 | 0.489089 | 16.7352 |
| 1 | 16010012 | 0.489470 | 0.00218999 | 16.9054 | 16010011 | 0.00000 | 0.491660 | 17.3508 |
| 2 | 16010013 | 0.490930 | 0.000730008 | 16.3192 | 16010018 | 0.00453257 | 0.487127 | 16.2710 |
| 3 | 16010016 | 0.491505 | 0.000155002 | 15.6120 | 16010015 | 0.00343335 | 0.488227 | 15.0689 |