| Red | Green | Blue | |
| z | 17.64 | ||
| znorm | Inf | ||
| sky | -Inf | -Inf | -Inf |
| S/N | 25.7 | 43.8 | 49.6 |
| S/N(c) | 0.0 | 0.0 | 0.0 |
| SN(E/C) |
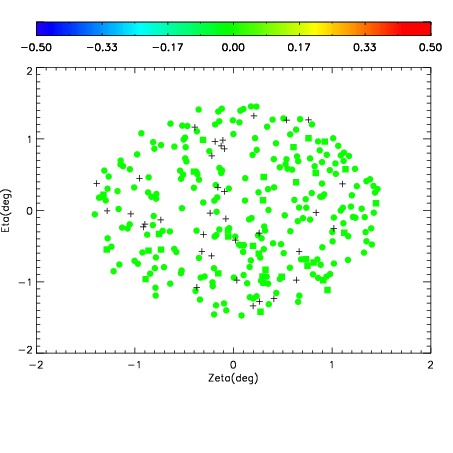
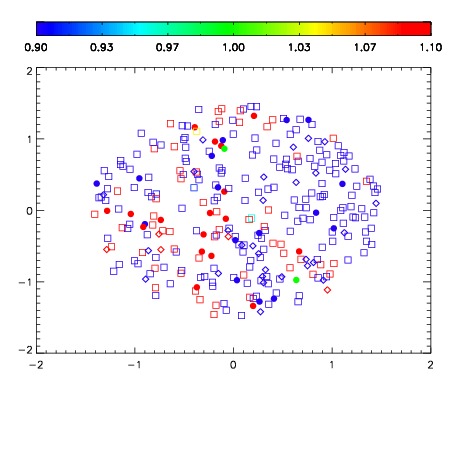
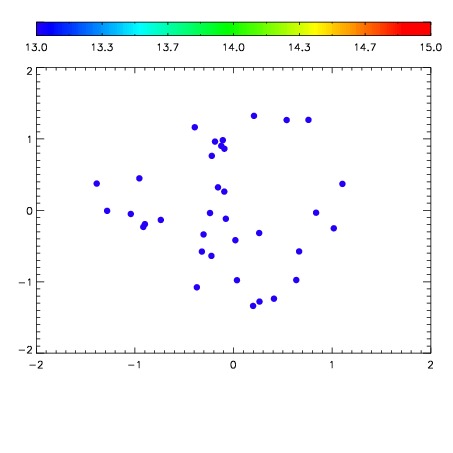

| Frame | Nreads | Zeropoints | Mag plots | Spatial mag deviation | Spatial sky 16325A emission deviations (filled: sky, open: star) | Spatial sky continuum emission | Spatial sky telluric CO2 absorption deviations (filled: H < 10) | |||||||||||||||||||||||
| 0 | 0 |
|
|
|
|
|
|
| IPAIR | NAME | SHIFT | NEWSHIFT | S/N | NAME | SHIFT | NEWSHIFT | S/N |
| 0 | 16020030 | 0.00325492 | 0.00000 | 17.7504 | 16020029 | -0.486608 | 0.489863 | 17.7161 |
| 1 | 16020027 | 0.00281396 | 0.000440960 | 18.5701 | 16020028 | -0.486141 | 0.489396 | 18.5561 |
| 2 | 16020026 | 0.00221734 | 0.00103758 | 18.5325 | 16020025 | -0.486715 | 0.489970 | 18.5469 |
| 3 | 16020031 | 0.00198564 | 0.00126928 | 18.4959 | 16020020 | -0.486583 | 0.489838 | 18.4915 |
| 4 | 16020022 | 0.00123674 | 0.00201818 | 18.4654 | 16020032 | -0.486653 | 0.489908 | 18.4840 |
| 5 | 16020019 | 0.00000 | 0.00325492 | 18.3977 | 16020021 | -0.487428 | 0.490683 | 18.4499 |
| 6 | 16020023 | 0.00151176 | 0.00174316 | 18.0412 | 16020024 | -0.487112 | 0.490367 | 18.0076 |