| Red | Green | Blue | |
| z | 17.64 | ||
| znorm | Inf | ||
| sky | -Inf | -Inf | -Inf |
| S/N | 13.2 | 23.0 | 26.7 |
| S/N(c) | 0.0 | 0.0 | 0.0 |
| SN(E/C) |
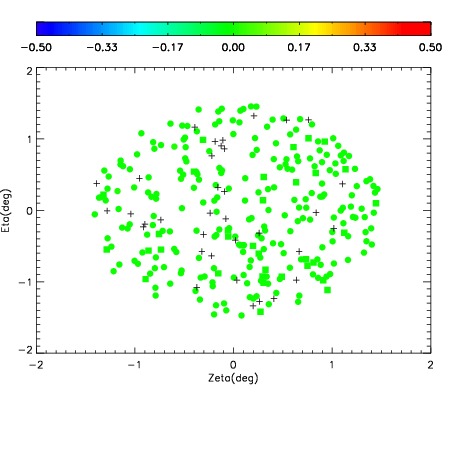
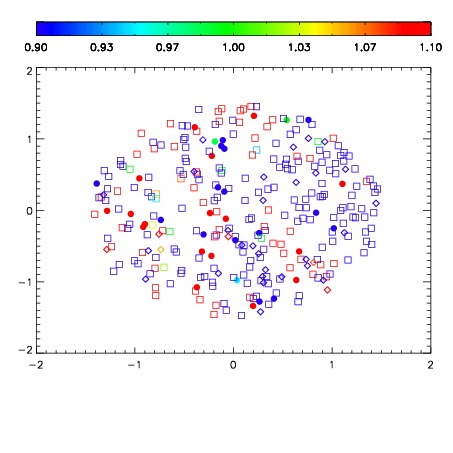


| Frame | Nreads | Zeropoints | Mag plots | Spatial mag deviation | Spatial sky 16325A emission deviations (filled: sky, open: star) | Spatial sky continuum emission | Spatial sky telluric CO2 absorption deviations (filled: H < 10) | |||||||||||||||||||||||
| 0 | 0 |
|
|
|
|
|
|
| IPAIR | NAME | SHIFT | NEWSHIFT | S/N | NAME | SHIFT | NEWSHIFT | S/N |
| 0 | 16030031 | 0.487262 | 0.00000 | 17.5785 | 16030029 | 0.00000 | 0.487262 | 17.9727 |
| 1 | 16030034 | 0.485689 | 0.00157300 | 18.4793 | 16030033 | -0.000967374 | 0.488229 | 18.3192 |
| 2 | 16030030 | 0.486689 | 0.000573009 | 17.5380 | 16030032 | -0.000608322 | 0.487870 | 17.6191 |