| Red | Green | Blue | |
| z | 17.64 | ||
| znorm | Inf | ||
| sky | -Inf | -Inf | -NaN |
| S/N | 18.1 | 31.9 | 37.6 |
| S/N(c) | 0.0 | 0.0 | 0.0 |
| SN(E/C) |
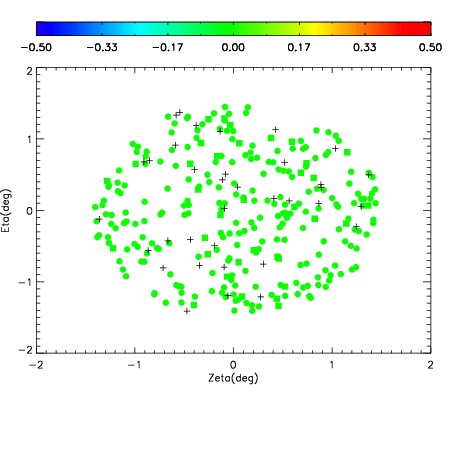
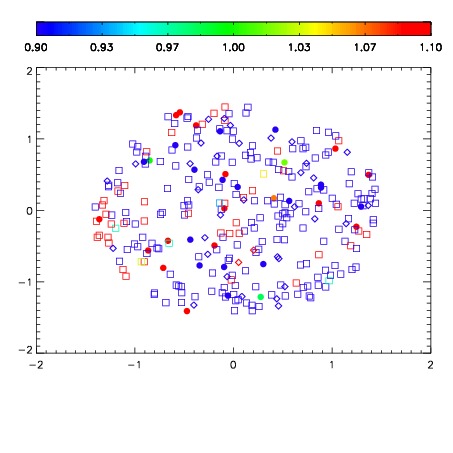
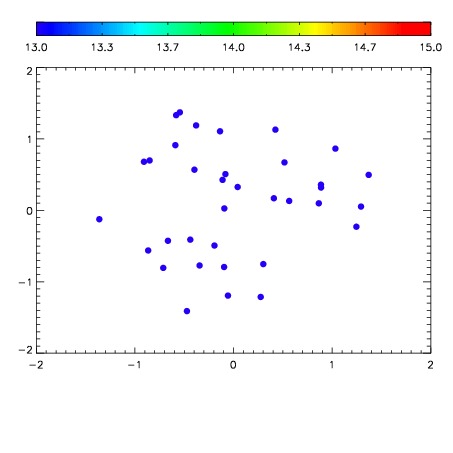

| Frame | Nreads | Zeropoints | Mag plots | Spatial mag deviation | Spatial sky 16325A emission deviations (filled: sky, open: star) | Spatial sky continuum emission | Spatial sky telluric CO2 absorption deviations (filled: H < 10) | |||||||||||||||||||||||
| 0 | 0 |
|
|
|
|
|
|
| IPAIR | NAME | SHIFT | NEWSHIFT | S/N | NAME | SHIFT | NEWSHIFT | S/N |
| 0 | 17050017 | 0.487600 | 0.00000 | 17.2076 | 17050018 | 0.00334129 | 0.484259 | 17.2996 |
| 1 | 17050012 | 0.484639 | 0.00296101 | 18.6062 | 17050011 | 0.00000 | 0.487600 | 18.7321 |
| 2 | 17050013 | 0.485989 | 0.00161099 | 18.3861 | 17050014 | 0.000821744 | 0.486778 | 18.4868 |
| 3 | 17050016 | 0.486740 | 0.000860006 | 18.2631 | 17050015 | 0.00262354 | 0.484976 | 18.4021 |