| Red | Green | Blue | |
| z | 17.64 | ||
| znorm | Inf | ||
| sky | -NaN | -Inf | -NaN |
| S/N | 27.1 | 46.4 | 53.5 |
| S/N(c) | 0.0 | 0.0 | 0.0 |
| SN(E/C) |
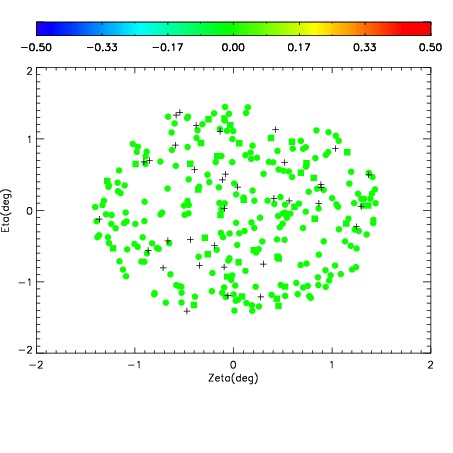
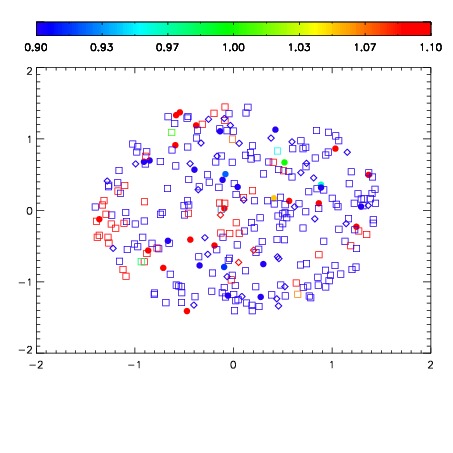
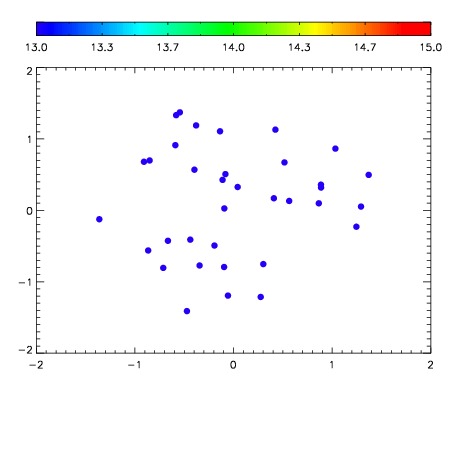

| Frame | Nreads | Zeropoints | Mag plots | Spatial mag deviation | Spatial sky 16325A emission deviations (filled: sky, open: star) | Spatial sky continuum emission | Spatial sky telluric CO2 absorption deviations (filled: H < 10) | |||||||||||||||||||||||
| 0 | 0 |
|
|
|
|
|
|
| IPAIR | NAME | SHIFT | NEWSHIFT | S/N | NAME | SHIFT | NEWSHIFT | S/N |
| 0 | 17090024 | 0.491492 | 0.00000 | 18.5769 | 17090023 | 0.00673929 | 0.484753 | 18.4810 |
| 1 | 17090013 | 0.488945 | 0.00254700 | 19.0596 | 17090011 | 0.00000 | 0.491492 | 19.0724 |
| 2 | 17090012 | 0.488615 | 0.00287700 | 19.0516 | 17090014 | 0.00232238 | 0.489170 | 19.0440 |
| 3 | 17090017 | 0.490737 | 0.000755012 | 18.5442 | 17090018 | 0.00573815 | 0.485754 | 18.4763 |
| 4 | 17090020 | 0.490665 | 0.000827014 | 18.4037 | 17090015 | 0.00357642 | 0.487916 | 18.0538 |
| 5 | 17090016 | 0.490693 | 0.000799000 | 17.9412 | 17090019 | 0.00655218 | 0.484940 | 18.0391 |
| 6 | 17090021 | 0.491383 | 0.000109017 | 17.4701 | 17090022 | 0.00732899 | 0.484163 | 17.4777 |