| Red | Green | Blue | |
| z | 17.64 | ||
| znorm | Inf | ||
| sky | -Inf | -Inf | -Inf |
| S/N | 15.1 | 27.2 | 28.0 |
| S/N(c) | 0.0 | 0.0 | 0.0 |
| SN(E/C) |
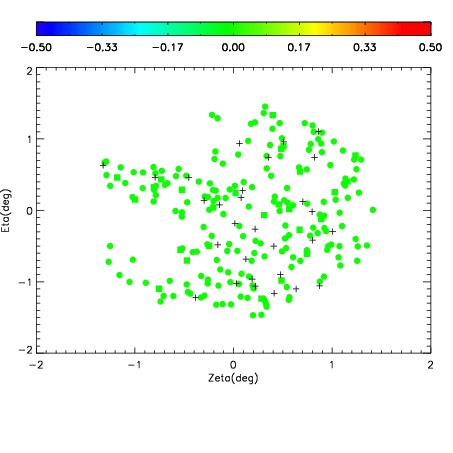
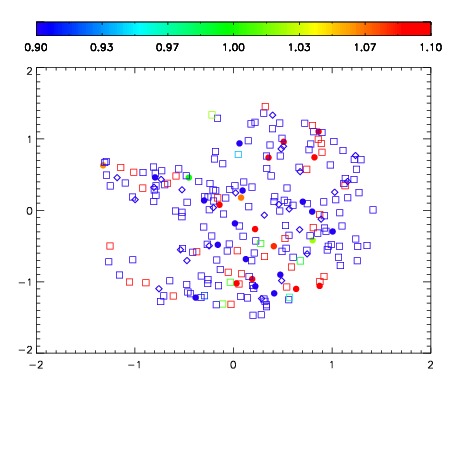
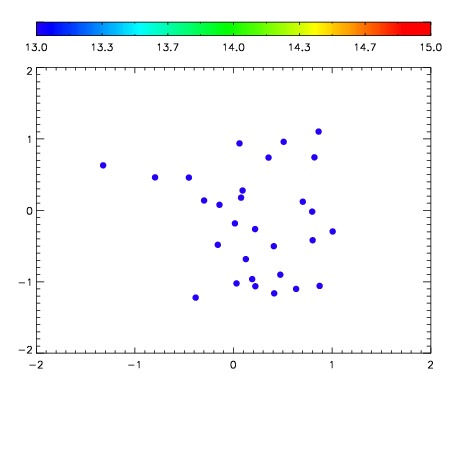

| Frame | Nreads | Zeropoints | Mag plots | Spatial mag deviation | Spatial sky 16325A emission deviations (filled: sky, open: star) | Spatial sky continuum emission | Spatial sky telluric CO2 absorption deviations (filled: H < 10) | |||||||||||||||||||||||
| 0 | 0 |
|
|
|
|
|
|
| IPAIR | NAME | SHIFT | NEWSHIFT | S/N | NAME | SHIFT | NEWSHIFT | S/N |
| 0 | 16300043 | 0.491917 | 0.00000 | 18.0950 | 16300041 | 0.000966855 | 0.490950 | 18.1066 |
| 1 | 16300039 | 0.491736 | 0.000181019 | 18.4242 | 16300038 | 0.00000 | 0.491917 | 18.5349 |
| 2 | 16300044 | 0.491220 | 0.000697017 | 17.9228 | 16300042 | 0.00200555 | 0.489911 | 18.0915 |