| Red | Green | Blue | |
| z | 17.64 | ||
| znorm | Inf | ||
| sky | -Inf | -Inf | -Inf |
| S/N | 29.8 | 52.1 | 53.7 |
| S/N(c) | 0.0 | 0.0 | 0.0 |
| SN(E/C) |
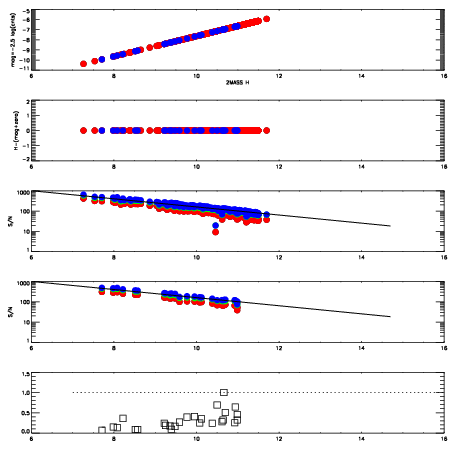
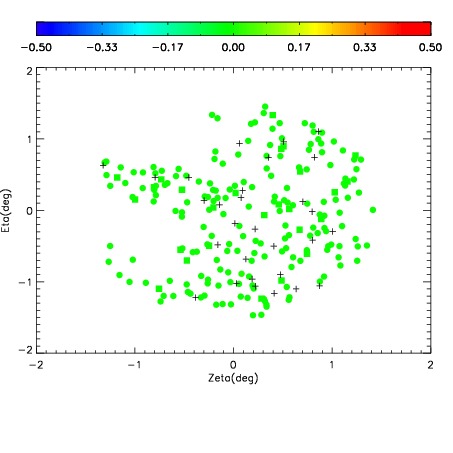
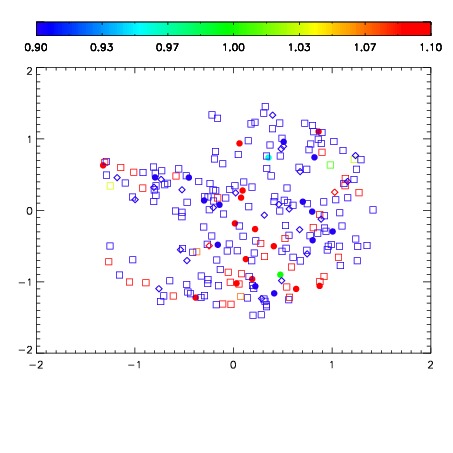
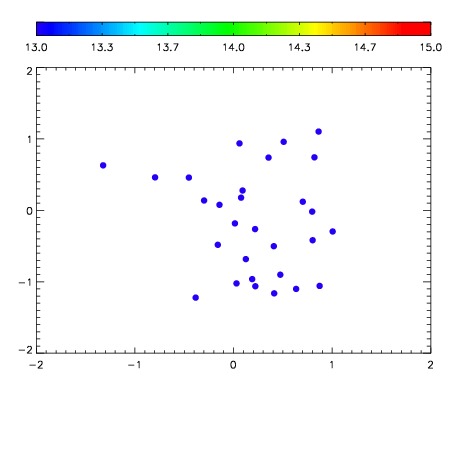

| Frame | Nreads | Zeropoints | Mag plots | Spatial mag deviation | Spatial sky 16325A emission deviations (filled: sky, open: star) | Spatial sky continuum emission | Spatial sky telluric CO2 absorption deviations (filled: H < 10) | |||||||||||||||||||||||
| 0 | 0 |
|
|
|
|
|
|
| IPAIR | NAME | SHIFT | NEWSHIFT | S/N | NAME | SHIFT | NEWSHIFT | S/N |
| 0 | 16320017 | 0.493243 | 0.00000 | 17.9127 | 16320018 | 0.00255604 | 0.490687 | 17.8746 |
| 1 | 16320013 | 0.490185 | 0.00305802 | 18.9188 | 16320014 | -0.000665761 | 0.493909 | 19.0064 |
| 2 | 16320012 | 0.489289 | 0.00395402 | 18.8091 | 16320011 | 0.00000 | 0.493243 | 18.8312 |
| 3 | 16320020 | 0.491065 | 0.00217801 | 18.7947 | 16320019 | 0.00232480 | 0.490918 | 18.7745 |
| 4 | 16320025 | 0.493220 | 2.30074e-05 | 18.7276 | 16320026 | 0.00247956 | 0.490763 | 18.6986 |
| 5 | 16320021 | 0.491551 | 0.00169200 | 18.1793 | 16320022 | 0.000496671 | 0.492746 | 18.2712 |
| 6 | 16320016 | 0.491386 | 0.00185701 | 18.0460 | 16320023 | 0.00229163 | 0.490951 | 18.0093 |
| 7 | 16320024 | 0.493005 | 0.000238001 | 18.0063 | 16320015 | 0.00131968 | 0.491923 | 17.9493 |