| Red | Green | Blue | |
| z | 17.64 | ||
| znorm | Inf | ||
| sky | -Inf | -NaN | -Inf |
| S/N | 15.8 | 28.6 | 32.6 |
| S/N(c) | 0.0 | 0.0 | 0.0 |
| SN(E/C) |
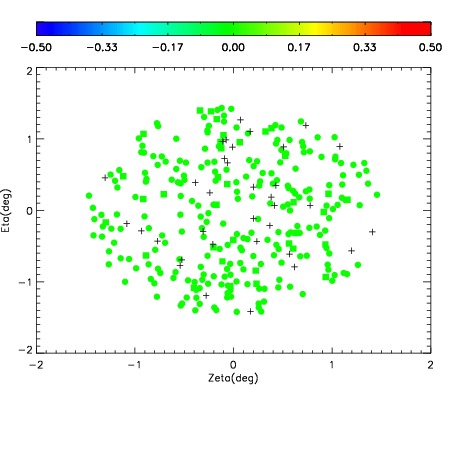
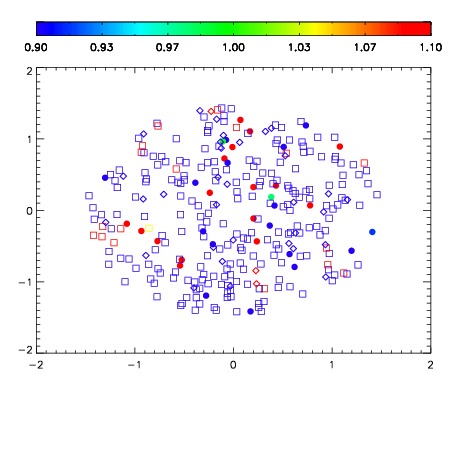
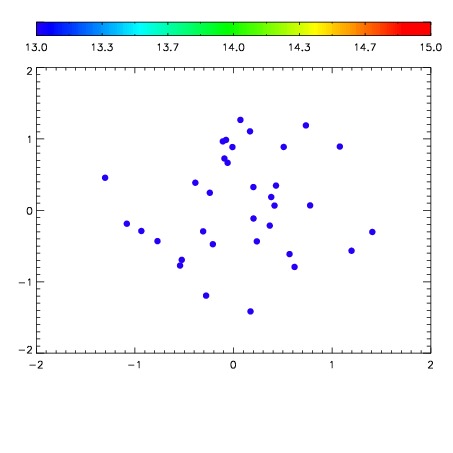

| Frame | Nreads | Zeropoints | Mag plots | Spatial mag deviation | Spatial sky 16325A emission deviations (filled: sky, open: star) | Spatial sky continuum emission | Spatial sky telluric CO2 absorption deviations (filled: H < 10) | |||||||||||||||||||||||
| 0 | 0 |
|
|
|
|
|
|
| IPAIR | NAME | SHIFT | NEWSHIFT | S/N | NAME | SHIFT | NEWSHIFT | S/N |
| 0 | 19530029 | 0.00000 | 0.00000 | 18.1852 | 19530030 | -0.487453 | 0.487453 | 18.4022 |
| 1 | 19530032 | -0.00206551 | 0.00206551 | 18.2913 | 19530031 | -0.487108 | 0.487108 | 18.4270 |
| 2 | 19530033 | -0.00220178 | 0.00220178 | 18.0648 | 19530034 | -0.489139 | 0.489139 | 18.1133 |