| Red | Green | Blue | |
| z | 17.64 | ||
| znorm | Inf | ||
| sky | -Inf | -Inf | -NaN |
| S/N | 15.0 | 27.6 | 31.6 |
| S/N(c) | 0.0 | 0.0 | 0.0 |
| SN(E/C) |
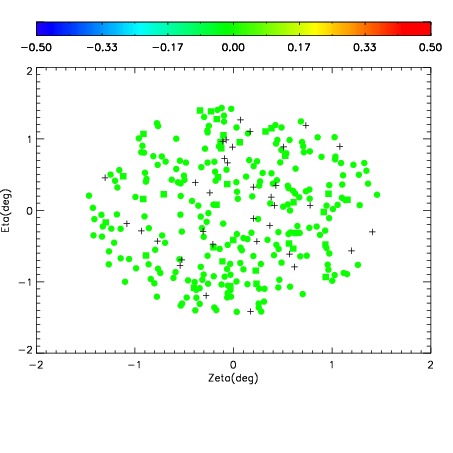
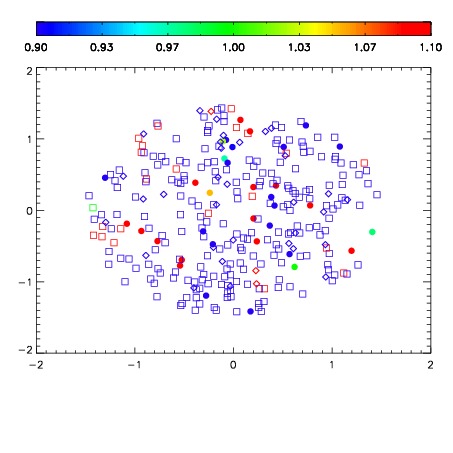
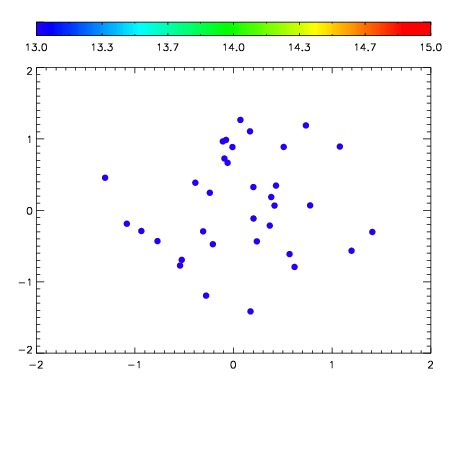

| Frame | Nreads | Zeropoints | Mag plots | Spatial mag deviation | Spatial sky 16325A emission deviations (filled: sky, open: star) | Spatial sky continuum emission | Spatial sky telluric CO2 absorption deviations (filled: H < 10) | |||||||||||||||||||||||
| 0 | 0 |
|
|
|
|
|
|
| IPAIR | NAME | SHIFT | NEWSHIFT | S/N | NAME | SHIFT | NEWSHIFT | S/N |
| 0 | 19540030 | 0.498303 | 0.00000 | 17.7839 | 19540029 | 0.00000 | 0.498303 | 17.8722 |
| 1 | 19540034 | 0.497744 | 0.000559002 | 18.3773 | 19540033 | -0.000823906 | 0.499127 | 18.4786 |
| 2 | 19540031 | 0.497716 | 0.000586987 | 17.9590 | 19540032 | -0.000562831 | 0.498866 | 17.9223 |