| Red | Green | Blue | |
| z | 17.64 | ||
| znorm | Inf | ||
| sky | -Inf | -NaN | -NaN |
| S/N | 15.0 | 27.8 | 31.6 |
| S/N(c) | 0.0 | 0.0 | 0.0 |
| SN(E/C) |
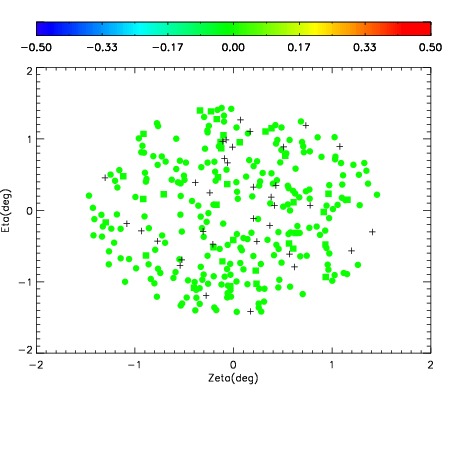
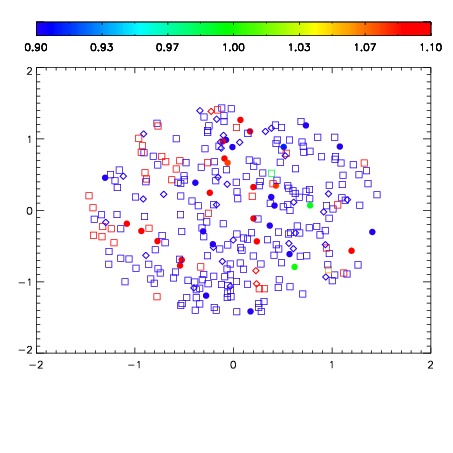
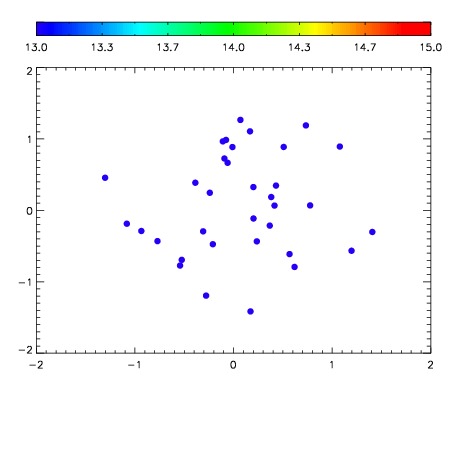

| Frame | Nreads | Zeropoints | Mag plots | Spatial mag deviation | Spatial sky 16325A emission deviations (filled: sky, open: star) | Spatial sky continuum emission | Spatial sky telluric CO2 absorption deviations (filled: H < 10) | |||||||||||||||||||||||
| 0 | 0 |
|
|
|
|
|
|
| IPAIR | NAME | SHIFT | NEWSHIFT | S/N | NAME | SHIFT | NEWSHIFT | S/N |
| 0 | 19550013 | 0.493740 | 0.00000 | 18.3259 | 19550014 | -3.07931e-05 | 0.493771 | 18.2386 |
| 1 | 19550012 | 0.493241 | 0.000498980 | 18.2616 | 19550011 | 0.00000 | 0.493740 | 18.1718 |
| 2 | 19550016 | 0.490306 | 0.00343400 | 17.9949 | 19550015 | 0.000452908 | 0.493287 | 17.9826 |