| Red | Green | Blue | |
| z | 17.64 | ||
| znorm | Inf | ||
| sky | -Inf | -NaN | -NaN |
| S/N | 18.1 | 32.8 | 36.5 |
| S/N(c) | 0.0 | 0.0 | 0.0 |
| SN(E/C) |
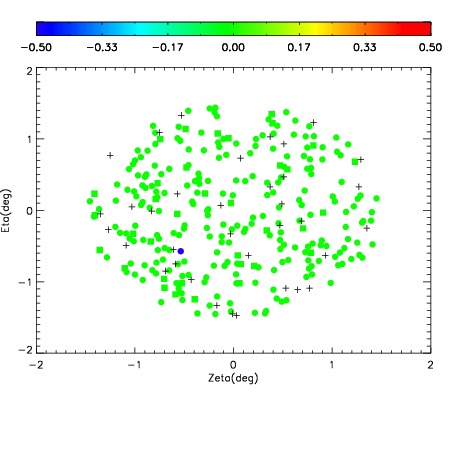
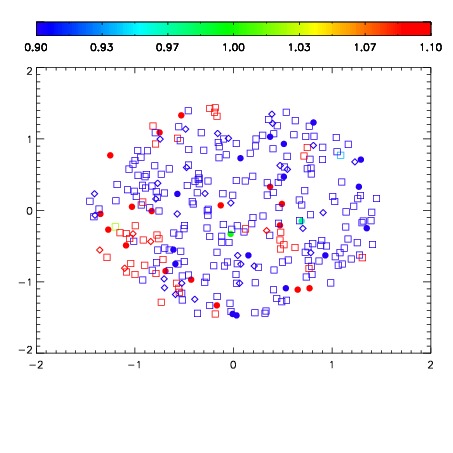
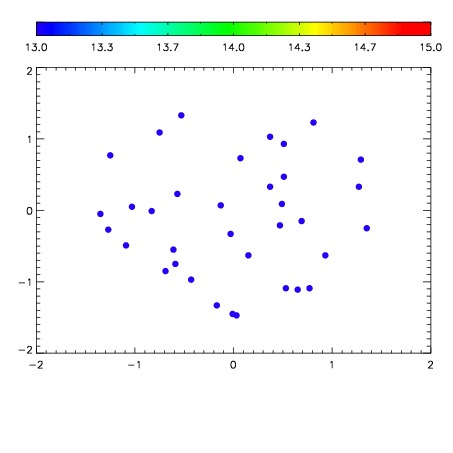

| Frame | Nreads | Zeropoints | Mag plots | Spatial mag deviation | Spatial sky 16325A emission deviations (filled: sky, open: star) | Spatial sky continuum emission | Spatial sky telluric CO2 absorption deviations (filled: H < 10) | |||||||||||||||||||||||
| 0 | 0 |
|
|
|
|
|
|
| IPAIR | NAME | SHIFT | NEWSHIFT | S/N | NAME | SHIFT | NEWSHIFT | S/N |
| 0 | 16930024 | 0.490154 | 0.00000 | 17.9457 | 16930021 | 0.00208085 | 0.488073 | 17.9921 |
| 1 | 16930023 | 0.488959 | 0.00119498 | 18.4571 | 16930022 | 0.00106644 | 0.489088 | 18.4691 |
| 2 | 16930019 | 0.487570 | 0.00258401 | 18.1353 | 16930025 | 0.000300241 | 0.489854 | 18.2611 |
| 3 | 16930020 | 0.488980 | 0.00117400 | 17.9513 | 16930018 | 0.00000 | 0.490154 | 18.2370 |