| Red | Green | Blue | |
| z | 17.64 | ||
| znorm | Inf | ||
| sky | -Inf | -Inf | -NaN |
| S/N | 17.1 | 29.9 | 33.7 |
| S/N(c) | 0.0 | 0.0 | 0.0 |
| SN(E/C) |
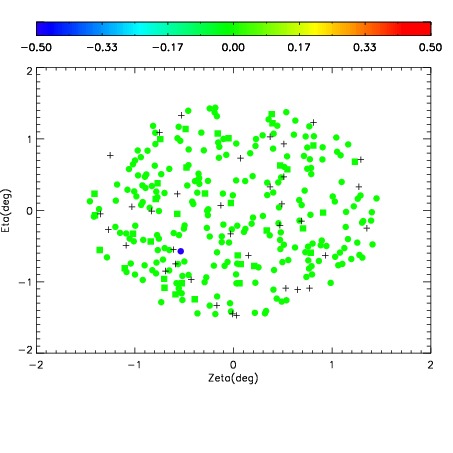
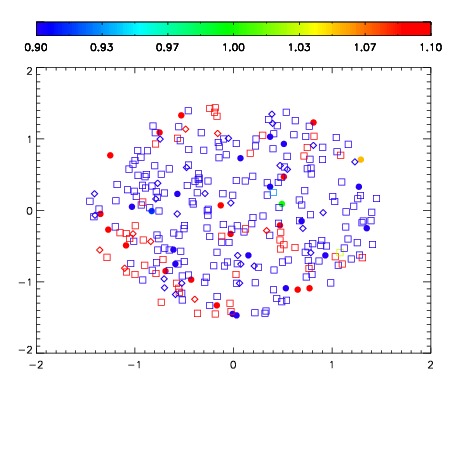
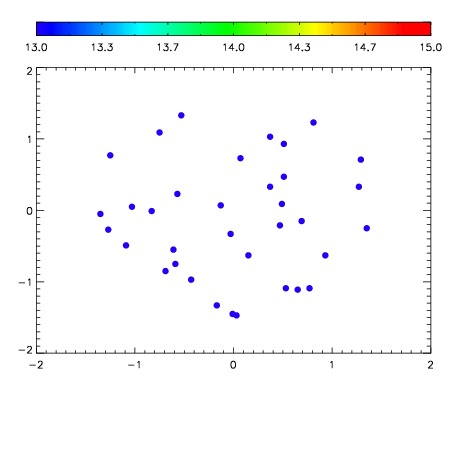

| Frame | Nreads | Zeropoints | Mag plots | Spatial mag deviation | Spatial sky 16325A emission deviations (filled: sky, open: star) | Spatial sky continuum emission | Spatial sky telluric CO2 absorption deviations (filled: H < 10) | |||||||||||||||||||||||
| 0 | 0 |
|
|
|
|
|
|
| IPAIR | NAME | SHIFT | NEWSHIFT | S/N | NAME | SHIFT | NEWSHIFT | S/N |
| 0 | 17070019 | 0.000937932 | 0.00000 | 18.0791 | 17070018 | -0.487802 | 0.488740 | 17.9976 |
| 1 | 17070020 | 0.000636340 | 0.000301592 | 18.5300 | 17070021 | -0.487287 | 0.488225 | 18.5193 |
| 2 | 17070016 | 0.00000 | 0.000937932 | 18.1931 | 17070017 | -0.488287 | 0.489225 | 18.1908 |