| Red | Green | Blue | |
| z | 17.64 | ||
| znorm | Inf | ||
| sky | -Inf | -Inf | -NaN |
| S/N | 20.2 | 36.7 | 41.3 |
| S/N(c) | 0.0 | 0.0 | 0.0 |
| SN(E/C) |
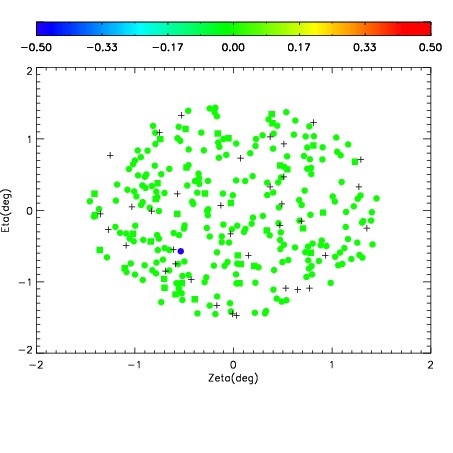
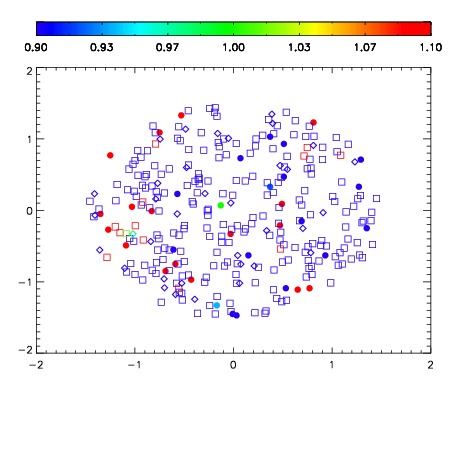
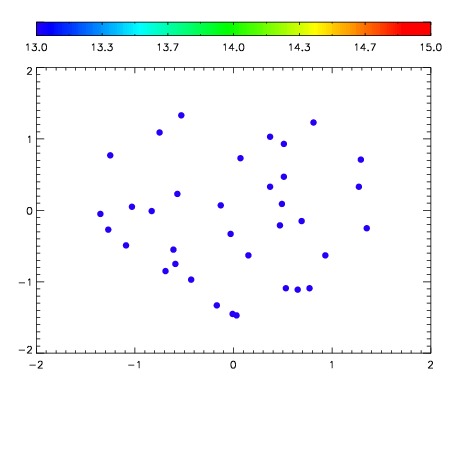

| Frame | Nreads | Zeropoints | Mag plots | Spatial mag deviation | Spatial sky 16325A emission deviations (filled: sky, open: star) | Spatial sky continuum emission | Spatial sky telluric CO2 absorption deviations (filled: H < 10) | |||||||||||||||||||||||
| 0 | 0 |
|
|
|
|
|
|
| IPAIR | NAME | SHIFT | NEWSHIFT | S/N | NAME | SHIFT | NEWSHIFT | S/N |
| 0 | 17090036 | 0.00130872 | 0.00000 | 15.9668 | 17090037 | -0.485749 | 0.487058 | 16.6028 |
| 1 | 17090043 | -0.00300307 | 0.00431179 | 18.5312 | 17090042 | -0.487600 | 0.488909 | 18.5908 |
| 2 | 17090040 | -0.00201370 | 0.00332242 | 18.3148 | 17090038 | -0.489187 | 0.490496 | 18.3180 |
| 3 | 17090032 | -0.00242633 | 0.00373505 | 18.2630 | 17090041 | -0.487363 | 0.488672 | 18.3045 |
| 4 | 17090039 | -0.00242389 | 0.00373261 | 18.1624 | 17090033 | -0.485136 | 0.486445 | 17.4287 |
| 5 | 17090031 | -0.00226888 | 0.00357760 | 17.9454 | 17090030 | -0.486800 | 0.488109 | 17.3637 |