| Red | Green | Blue | |
| z | 17.64 | ||
| znorm | Inf | ||
| sky | -Inf | -Inf | -Inf |
| S/N | 12.9 | 22.4 | 24.0 |
| S/N(c) | 0.0 | 0.0 | 0.0 |
| SN(E/C) |
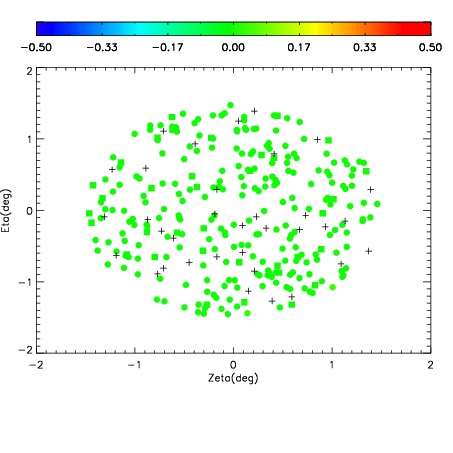
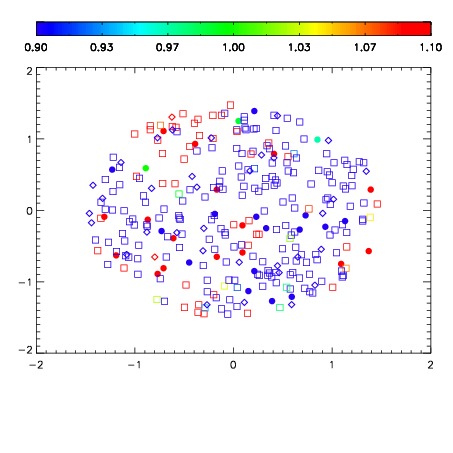
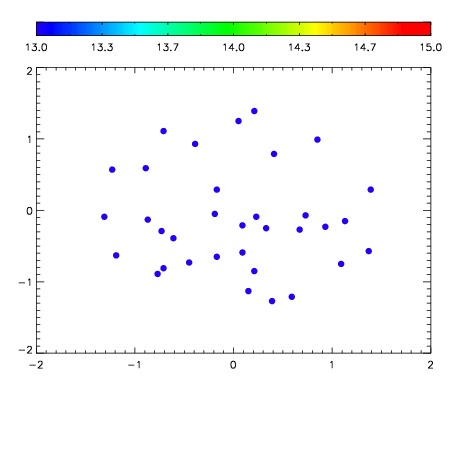

| Frame | Nreads | Zeropoints | Mag plots | Spatial mag deviation | Spatial sky 16325A emission deviations (filled: sky, open: star) | Spatial sky continuum emission | Spatial sky telluric CO2 absorption deviations (filled: H < 10) | |||||||||||||||||||||||
| 0 | 0 |
|
|
|
|
|
|
| IPAIR | NAME | SHIFT | NEWSHIFT | S/N | NAME | SHIFT | NEWSHIFT | S/N |
| 0 | 17120032 | 0.494931 | 0.00000 | 15.0218 | 17120030 | 0.00598376 | 0.488947 | 17.0850 |
| 1 | 17120024 | 0.487082 | 0.00784901 | 18.1407 | 17120026 | 0.00204491 | 0.492886 | 17.9320 |
| 2 | 17120025 | 0.488929 | 0.00600201 | 17.8416 | 17120023 | 0.00000 | 0.494931 | 17.8025 |
| 3 | 17120028 | 0.489739 | 0.00519201 | 17.7391 | 17120027 | 0.00307322 | 0.491858 | 17.5398 |
| 4 | 17120029 | 0.490961 | 0.00397003 | 17.2591 | 17120034 | 0.0105263 | 0.484405 | 17.3505 |