| Frame | Nreads | Zeropoints | Mag plots
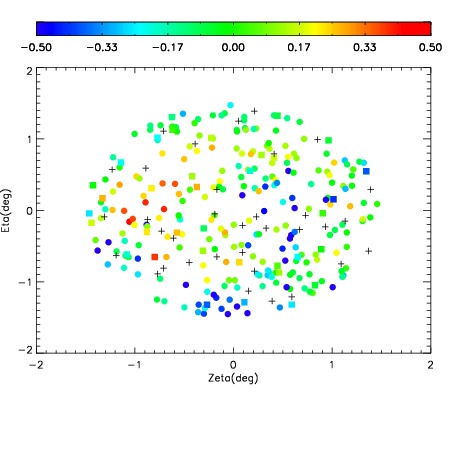
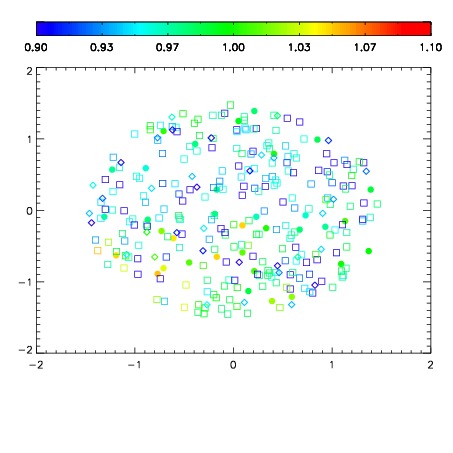
| Spatial mag deviation
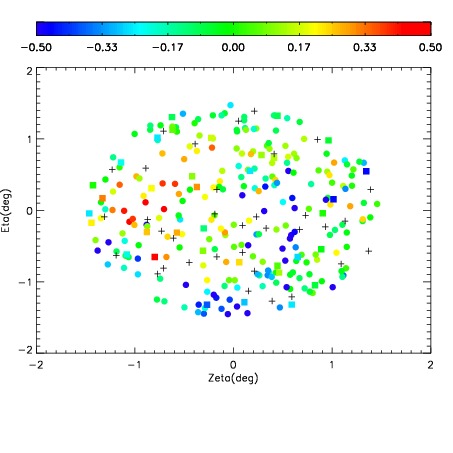
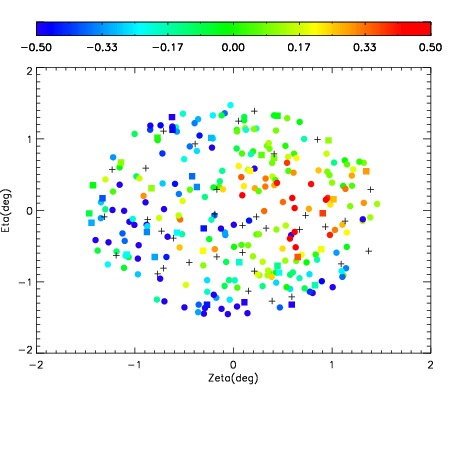
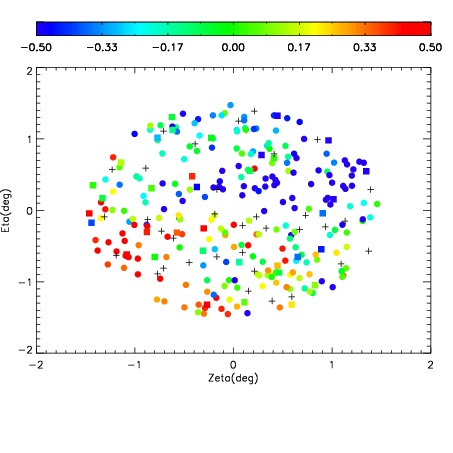
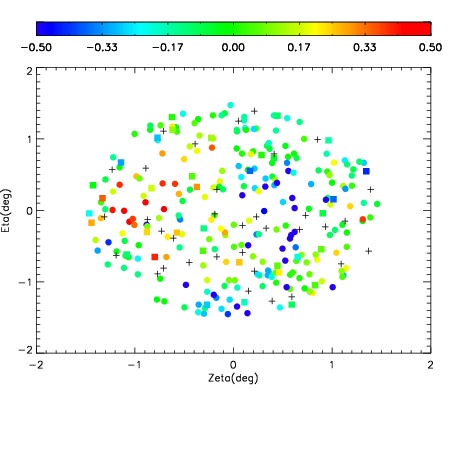
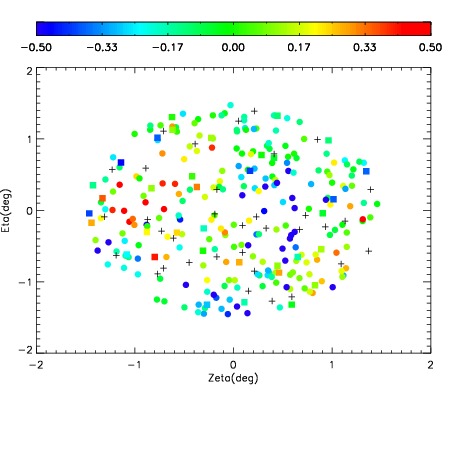
| Spatial sky 16325A emission deviations (filled: sky, open: star)
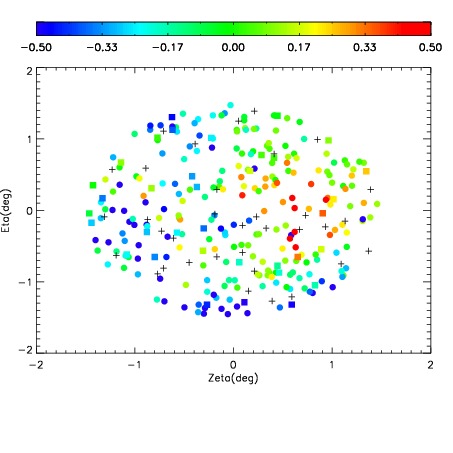
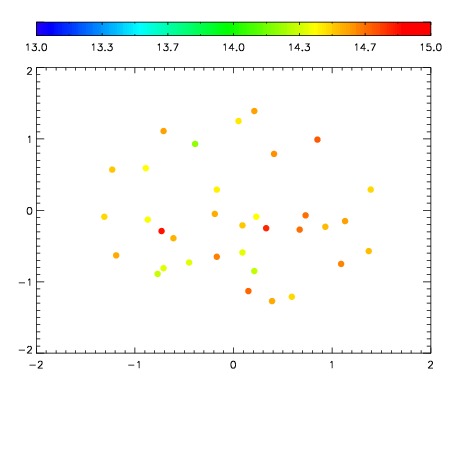
| Spatial sky continuum emission
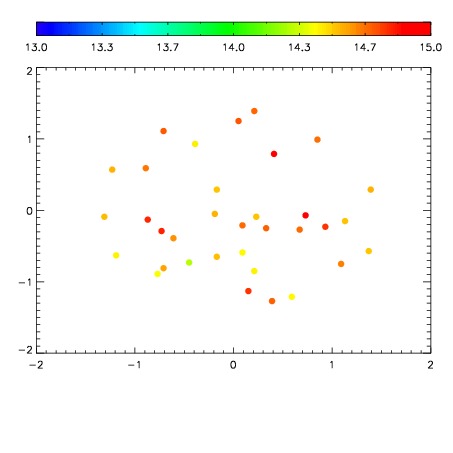
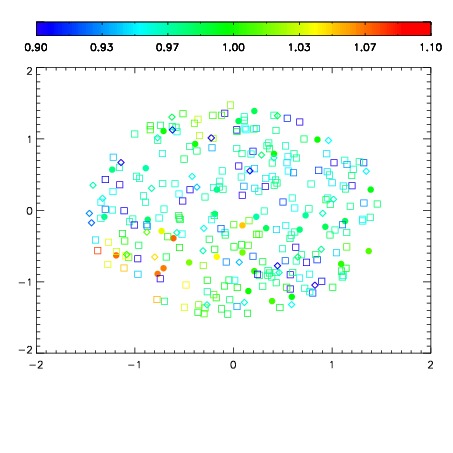
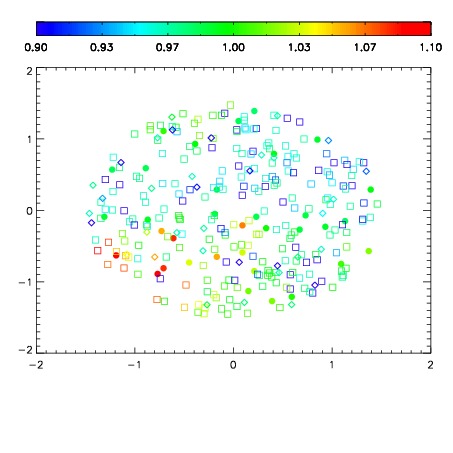
| Spatial sky telluric CO2 absorption deviations (filled: H < 10)
|
| 17150027
| 42
| | Red | Green | Blue
| | z | | 18.54
| | znorm | | 14.48
| | sky | 14.7 | 14.4 | 14.4
| | S/N | 7.2 | 12.9 | 12.8
| | S/N(c) | 15.1 | 18.4 | 6.8
| | SN(E/C) 0.61
|
| 
| 
| 
| 
| 
|
| 17150028
| 42
| | Red | Green | Blue
| | z | | 18.51
| | znorm | | 14.45
| | sky | 14.6 | 14.5 | 14.5
| | S/N | 6.2 | 11.8 | 11.7
| | S/N(c) | 14.6 | 17.9 | 6.7
| | SN(E/C) 0.61
|
| 
| 
| 
| 
| 
|
| 17150029
| 42
| | Red | Green | Blue
| | z | | 18.43
| | znorm | | 14.37
| | sky | 14.6 | 14.6 | 14.6
| | S/N | 15.2 | 25.1 | 26.6
| | S/N(c) | 13.2 | 16.7 | 6.1
| | SN(E/C) 0.66
|
| 
| 
| 
| 
| 
|
| 17150030
| 42
| | Red | Green | Blue
| | z | | 18.32
| | znorm | | 14.26
| | sky | 14.7 | 14.6 | 14.5
| | S/N | 13.6 | 23.2 | 24.4
| | S/N(c) | 12.4 | 15.6 | 5.7
| | SN(E/C) 0.65
|
| 
| 
| 
| 
| 
|
| 17150031
| 42
| | Red | Green | Blue
| | z | | 18.06
| | znorm | | 14.00
| | sky | 14.6 | 14.7 | 14.7
| | S/N | 3.4 | 7.1 | 7.3
| | S/N(c) | 10.6 | 14.0 | 5.0
| | SN(E/C) 0.71
|
| 
| 
| 
| 
| 
|
| 17150032
| 42
| | Red | Green | Blue
| | z | | 18.11
| | znorm | | 14.05
| | sky | 14.9 | 14.6 | 14.5
| | S/N | 3.2 | 7.5 | 7.1
| | S/N(c) | 10.9 | 14.2 | 5.1
| | SN(E/C) 0.67
|
| 
| 
| 
| 
| 
|
| 17150033
| 42
| | Red | Green | Blue
| | z | | 18.35
| | znorm | | 14.29
| | sky | 14.4 | 14.5 | 14.7
| | S/N | 4.9 | 10.2 | 10.3
| | S/N(c) | 13.1 | 16.4 | 6.0
| | SN(E/C) 0.64
|
| 
| 
| 
| 
| 
|
| 17150034
| 42
| | Red | Green | Blue
| | z | | 18.32
| | znorm | | 14.26
| | sky | 14.9 | 14.6 | 14.5
| | S/N | 4.9 | 10.0 | 10.5
| | S/N(c) | 13.0 | 16.2 | 6.0
| | SN(E/C) 0.63
|
| 
| 
| 
| 
| 
|