| Red | Green | Blue | |
| z | 17.64 | ||
| znorm | Inf | ||
| sky | -Inf | -Inf | -Inf |
| S/N | 15.1 | 27.6 | 28.7 |
| S/N(c) | 0.0 | 0.0 | 0.0 |
| SN(E/C) |
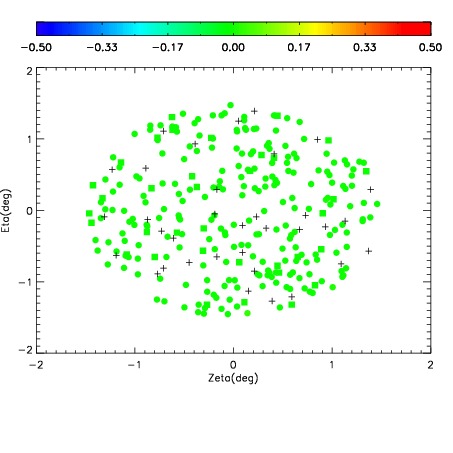
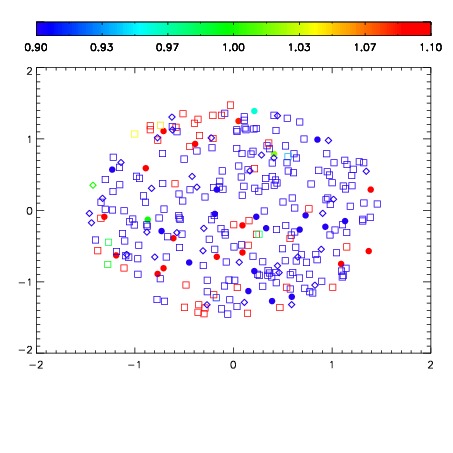
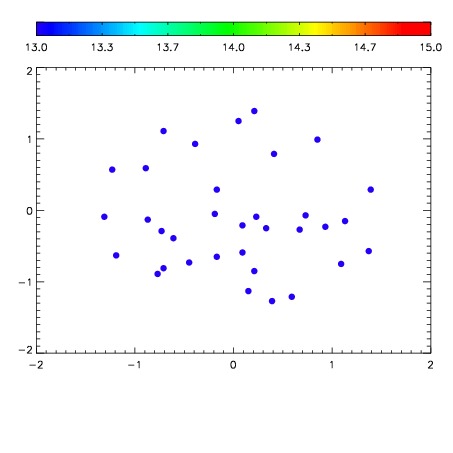

| Frame | Nreads | Zeropoints | Mag plots | Spatial mag deviation | Spatial sky 16325A emission deviations (filled: sky, open: star) | Spatial sky continuum emission | Spatial sky telluric CO2 absorption deviations (filled: H < 10) | |||||||||||||||||||||||
| 0 | 0 |
|
|
|
|
|
|
| IPAIR | NAME | SHIFT | NEWSHIFT | S/N | NAME | SHIFT | NEWSHIFT | S/N |
| 0 | 17150033 | 0.486493 | 0.00000 | 18.3213 | 17150030 | 0.00256040 | 0.483933 | 18.2707 |
| 1 | 17150028 | 0.483534 | 0.00295898 | 18.4814 | 17150027 | 0.00000 | 0.486493 | 18.5237 |
| 2 | 17150029 | 0.484452 | 0.00204098 | 18.3757 | 17150034 | 0.00443064 | 0.482062 | 18.2896 |
| 3 | 17150032 | 0.486165 | 0.000328004 | 18.0410 | 17150031 | 0.00333204 | 0.483161 | 17.9999 |