| Red | Green | Blue | |
| z | 17.64 | ||
| znorm | Inf | ||
| sky | -Inf | -Inf | -Inf |
| S/N | 21.1 | 36.3 | 37.6 |
| S/N(c) | 0.0 | 0.0 | 0.0 |
| SN(E/C) |
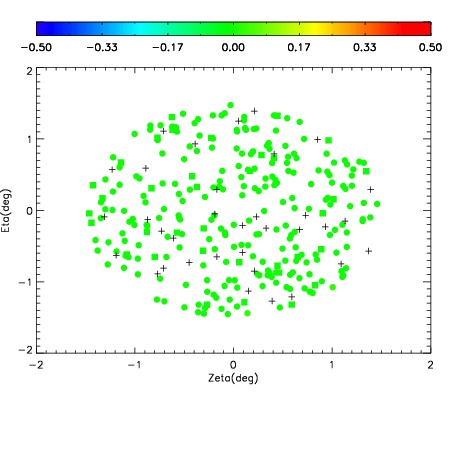
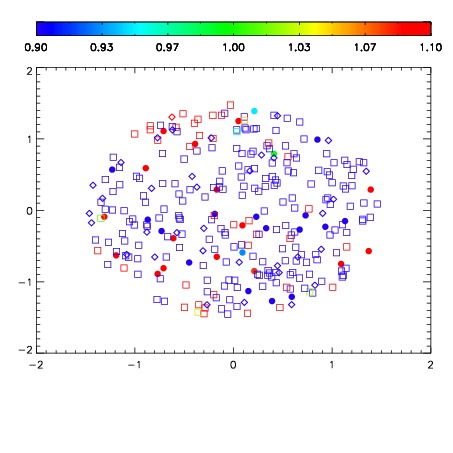
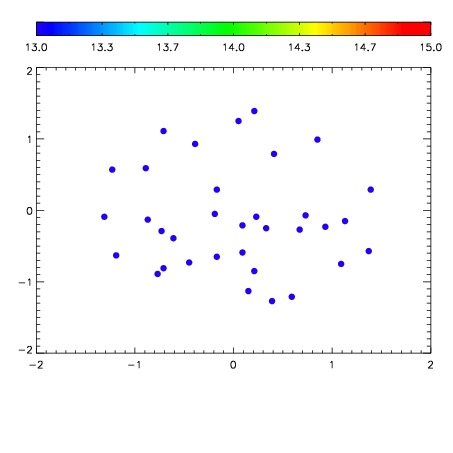

| Frame | Nreads | Zeropoints | Mag plots | Spatial mag deviation | Spatial sky 16325A emission deviations (filled: sky, open: star) | Spatial sky continuum emission | Spatial sky telluric CO2 absorption deviations (filled: H < 10) | |||||||||||||||||||||||
| 0 | 0 |
|
|
|
|
|
|
| IPAIR | NAME | SHIFT | NEWSHIFT | S/N | NAME | SHIFT | NEWSHIFT | S/N |
| 0 | 17160032 | 0.00488463 | 0.00000 | 18.1209 | 17160033 | -0.481645 | 0.486530 | 18.1855 |
| 1 | 17160035 | 0.00455584 | 0.000328790 | 18.5453 | 17160034 | -0.481659 | 0.486544 | 18.5781 |
| 2 | 17160028 | 0.00175562 | 0.00312901 | 18.5337 | 17160029 | -0.484872 | 0.489757 | 18.5244 |
| 3 | 17160031 | 0.00353601 | 0.00134862 | 18.4726 | 17160030 | -0.483974 | 0.488859 | 18.3446 |
| 4 | 17160024 | 0.00000 | 0.00488463 | 18.1708 | 17160025 | -0.486405 | 0.491290 | 18.2089 |
| 5 | 17160027 | 0.00133524 | 0.00354939 | 17.9451 | 17160026 | -0.486227 | 0.491112 | 17.8419 |