| Red | Green | Blue | |
| z | 17.64 | ||
| znorm | Inf | ||
| sky | -Inf | -Inf | -Inf |
| S/N | 26.2 | 47.3 | 50.3 |
| S/N(c) | 0.0 | 0.0 | 0.0 |
| SN(E/C) |
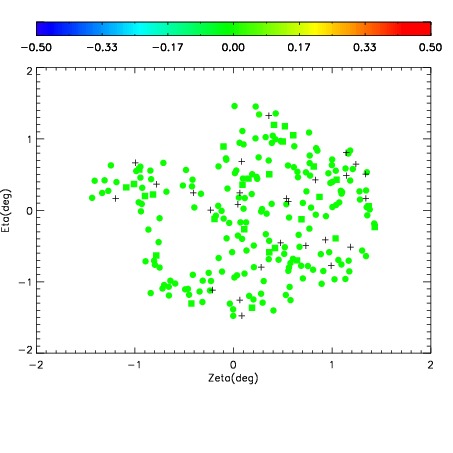
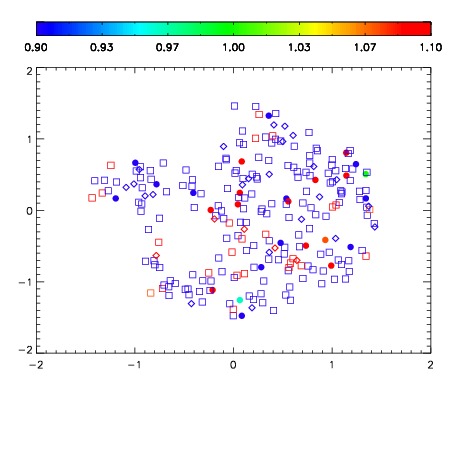
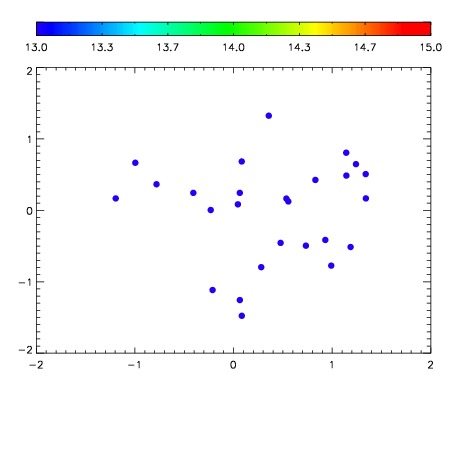

| Frame | Nreads | Zeropoints | Mag plots | Spatial mag deviation | Spatial sky 16325A emission deviations (filled: sky, open: star) | Spatial sky continuum emission | Spatial sky telluric CO2 absorption deviations (filled: H < 10) | |||||||||||||||||||||||
| 0 | 0 |
|
|
|
|
|
|
| IPAIR | NAME | SHIFT | NEWSHIFT | S/N | NAME | SHIFT | NEWSHIFT | S/N |
| 0 | 16340030 | 0.00288603 | 0.00000 | 18.0560 | 16340031 | -0.487403 | 0.490289 | 18.1098 |
| 1 | 16340033 | 0.00184946 | 0.00103657 | 18.5503 | 16340032 | -0.487752 | 0.490638 | 18.5908 |
| 2 | 16340026 | 0.00103601 | 0.00185002 | 18.5385 | 16340027 | -0.491304 | 0.494190 | 18.5731 |
| 3 | 16340022 | 0.00000 | 0.00288603 | 18.4361 | 16340028 | -0.491765 | 0.494651 | 18.5592 |
| 4 | 16340029 | 0.000582154 | 0.00230388 | 18.4351 | 16340023 | -0.492170 | 0.495056 | 18.4775 |
| 5 | 16340034 | 0.00280049 | 8.55399e-05 | 18.3038 | 16340035 | -0.487554 | 0.490440 | 18.2785 |
| 6 | 16340025 | 0.00247166 | 0.000414370 | 18.0142 | 16340024 | -0.491393 | 0.494279 | 18.0277 |