| Red | Green | Blue | |
| z | 17.64 | ||
| znorm | Inf | ||
| sky | -Inf | -Inf | -Inf |
| S/N | 20.3 | 36.4 | 40.2 |
| S/N(c) | 0.0 | 0.0 | 0.0 |
| SN(E/C) |
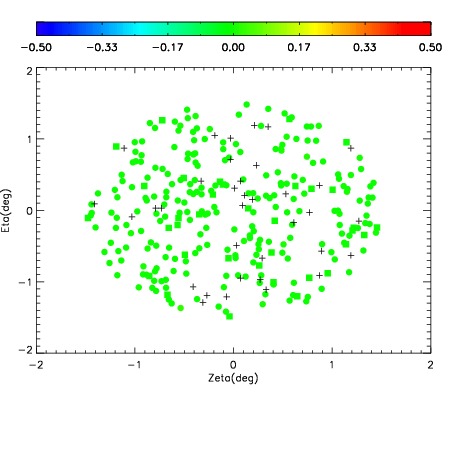
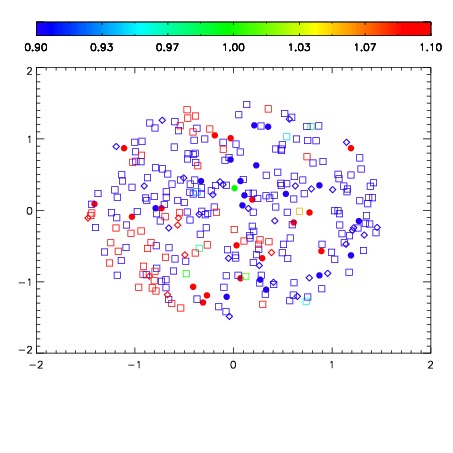
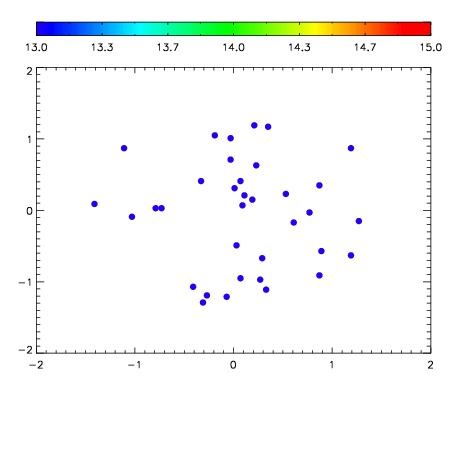

| Frame | Nreads | Zeropoints | Mag plots | Spatial mag deviation | Spatial sky 16325A emission deviations (filled: sky, open: star) | Spatial sky continuum emission | Spatial sky telluric CO2 absorption deviations (filled: H < 10) | |||||||||||||||||||||||
| 0 | 0 |
|
|
|
|
|
|
| IPAIR | NAME | SHIFT | NEWSHIFT | S/N | NAME | SHIFT | NEWSHIFT | S/N |
| 0 | 17190024 | 0.489136 | 0.00000 | 18.3716 | 17190023 | -0.00258083 | 0.491717 | 18.6306 |
| 1 | 17190021 | 0.484941 | 0.00419500 | 18.7514 | 17190022 | -0.00328005 | 0.492416 | 18.7009 |
| 2 | 17190020 | 0.485088 | 0.00404802 | 18.2869 | 17190019 | -0.00262428 | 0.491760 | 18.3439 |
| 3 | 17190013 | 0.485744 | 0.00339201 | 18.2646 | 17190018 | -0.00125338 | 0.490389 | 17.5298 |
| 4 | 17190016 | 0.485584 | 0.00355202 | 17.8735 | 17190015 | 0.00109414 | 0.488042 | 17.3010 |
| 5 | 17190012 | 0.487060 | 0.00207600 | 17.5208 | 17190011 | 0.00000 | 0.489136 | 17.1602 |