| Red | Green | Blue | |
| z | 17.64 | ||
| znorm | Inf | ||
| sky | -Inf | -Inf | -Inf |
| S/N | 19.6 | 33.5 | 37.7 |
| S/N(c) | 0.0 | 0.0 | 0.0 |
| SN(E/C) |

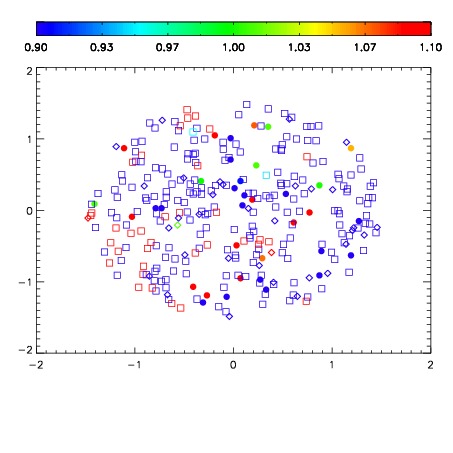
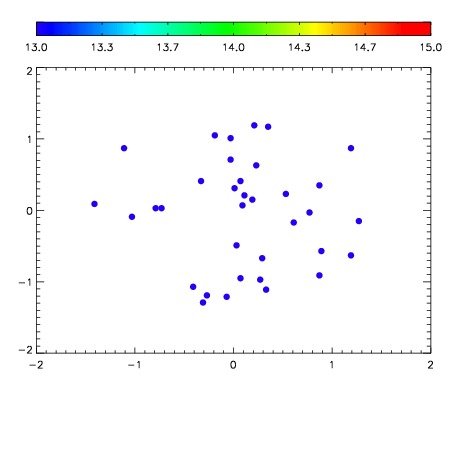

| Frame | Nreads | Zeropoints | Mag plots | Spatial mag deviation | Spatial sky 16325A emission deviations (filled: sky, open: star) | Spatial sky continuum emission | Spatial sky telluric CO2 absorption deviations (filled: H < 10) | |||||||||||||||||||||||
| 0 | 0 |
|
|
|
|
|
|
| IPAIR | NAME | SHIFT | NEWSHIFT | S/N | NAME | SHIFT | NEWSHIFT | S/N |
| 0 | 17220020 | 0.00302764 | 0.00000 | 18.4543 | 17220022 | -0.484883 | 0.487911 | 18.3563 |
| 1 | 17220016 | 0.00000 | 0.00302764 | 18.4771 | 17220018 | -0.479345 | 0.482373 | 18.5776 |
| 2 | 17220019 | 0.00147037 | 0.00155727 | 18.4596 | 17220021 | -0.485149 | 0.488177 | 18.3909 |
| 3 | 17220023 | 1.17484e-05 | 0.00301589 | 18.3132 | 17220017 | -0.479127 | 0.482155 | 18.1605 |