| Red | Green | Blue | |
| z | 17.64 | ||
| znorm | Inf | ||
| sky | -Inf | -Inf | -Inf |
| S/N | 21.6 | 41.3 | 44.5 |
| S/N(c) | 0.0 | 0.0 | 0.0 |
| SN(E/C) |
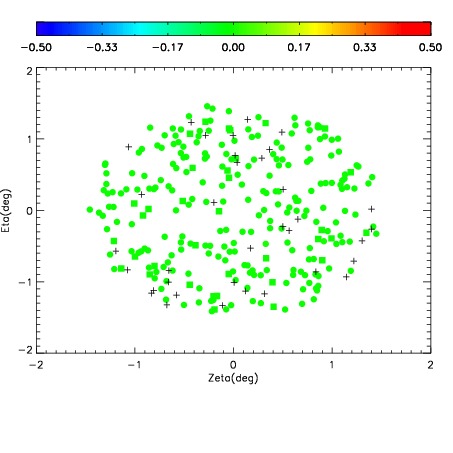
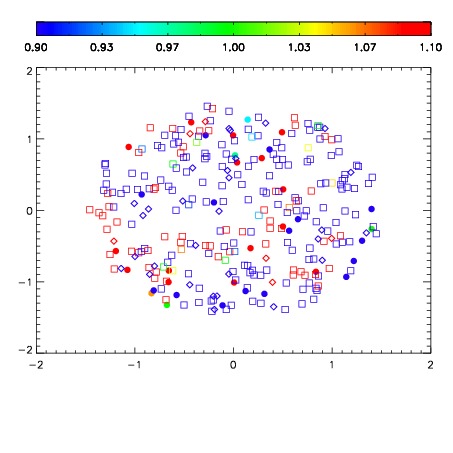
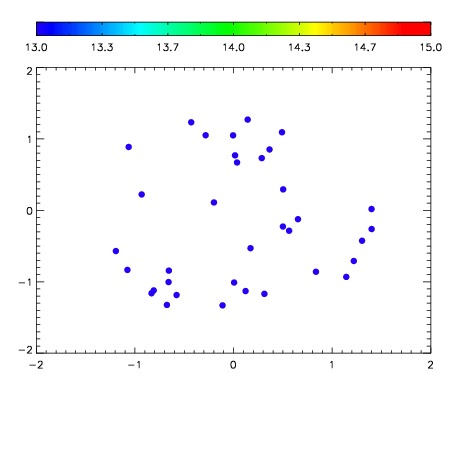

| Frame | Nreads | Zeropoints | Mag plots | Spatial mag deviation | Spatial sky 16325A emission deviations (filled: sky, open: star) | Spatial sky continuum emission | Spatial sky telluric CO2 absorption deviations (filled: H < 10) | |||||||||||||||||||||||
| 0 | 0 |
|
|
|
|
|
|
| IPAIR | NAME | SHIFT | NEWSHIFT | S/N | NAME | SHIFT | NEWSHIFT | S/N |
| 0 | 20170021 | 0.00000 | 0.00000 | 17.9765 | 20170022 | -0.498239 | 0.498239 | 17.7821 |
| 1 | 20170033 | -0.00452654 | 0.00452654 | 18.3764 | 20170026 | -0.497345 | 0.497345 | 18.4013 |
| 2 | 20170036 | -0.00917873 | 0.00917873 | 18.3287 | 20170035 | -0.498681 | 0.498681 | 18.3904 |
| 3 | 20170025 | -0.000897225 | 0.000897225 | 18.3063 | 20170031 | -0.498004 | 0.498004 | 18.2281 |
| 4 | 20170032 | -0.00425030 | 0.00425030 | 18.2702 | 20170034 | -0.498883 | 0.498883 | 18.2272 |
| 5 | 20170029 | -0.00378173 | 0.00378173 | 18.1796 | 20170030 | -0.496246 | 0.496246 | 18.2116 |
| 6 | 20170037 | -0.00941423 | 0.00941423 | 18.1248 | 20170027 | -0.497367 | 0.497367 | 18.2084 |
| 7 | 20170028 | -0.00437629 | 0.00437629 | 18.1225 | 20170038 | -0.496531 | 0.496531 | 18.0558 |
| 8 | 20170024 | -0.000792719 | 0.000792719 | 18.0515 | 20170023 | -0.497681 | 0.497681 | 17.9860 |