| Red | Green | Blue | |
| z | 17.64 | ||
| znorm | Inf | ||
| sky | -Inf | -Inf | -Inf |
| S/N | 13.5 | 25.1 | 27.4 |
| S/N(c) | 0.0 | 0.0 | 0.0 |
| SN(E/C) |
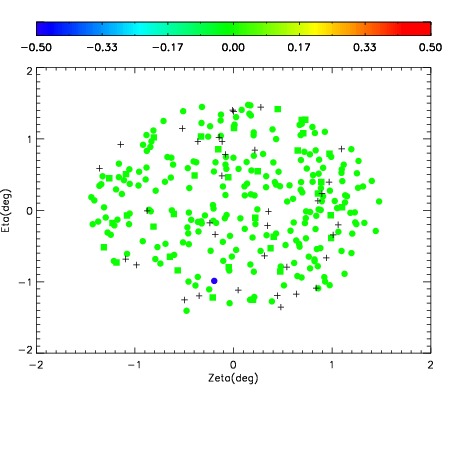
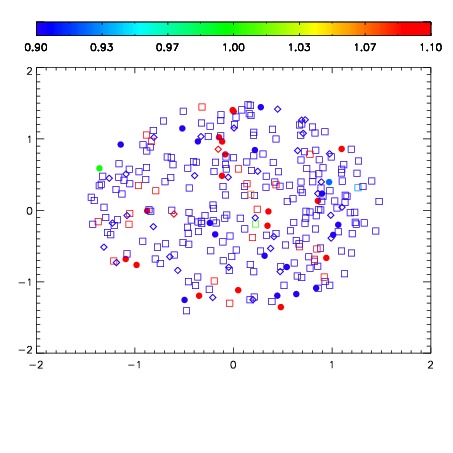
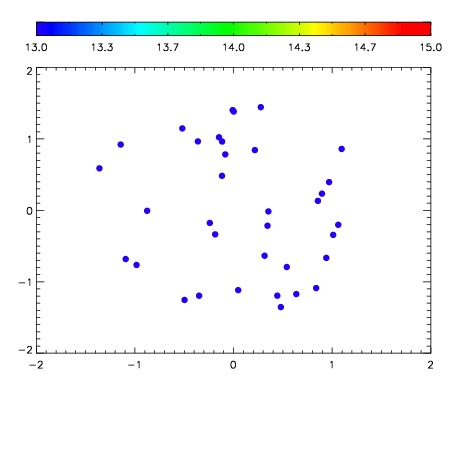

| Frame | Nreads | Zeropoints | Mag plots | Spatial mag deviation | Spatial sky 16325A emission deviations (filled: sky, open: star) | Spatial sky continuum emission | Spatial sky telluric CO2 absorption deviations (filled: H < 10) | |||||||||||||||||||||||
| 0 | 0 |
|
|
|
|
|
|
| IPAIR | NAME | SHIFT | NEWSHIFT | S/N | NAME | SHIFT | NEWSHIFT | S/N |
| 0 | 20100024 | 0.00106539 | 0.00000 | 17.9858 | 20100025 | -0.510247 | 0.511312 | 17.9656 |
| 1 | 20100020 | 0.00000 | 0.00106539 | 18.4504 | 20100021 | -0.507634 | 0.508699 | 18.4853 |
| 2 | 20100023 | 0.000914374 | 0.000151016 | 18.4019 | 20100022 | -0.508042 | 0.509107 | 18.4289 |