| Red | Green | Blue | |
| z | 17.64 | ||
| znorm | Inf | ||
| sky | -Inf | -Inf | -NaN |
| S/N | 24.8 | 44.6 | 48.6 |
| S/N(c) | 0.0 | 0.0 | 0.0 |
| SN(E/C) |
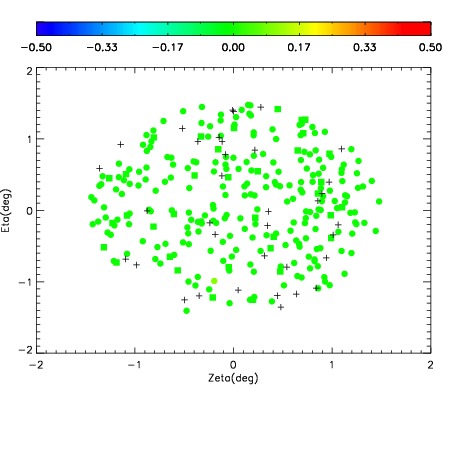
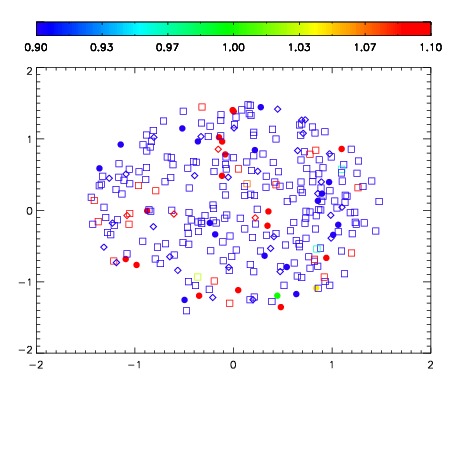
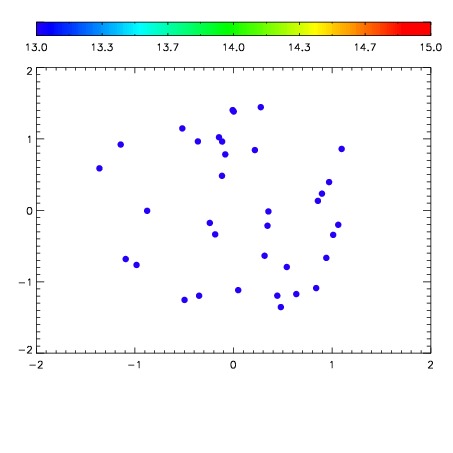

| Frame | Nreads | Zeropoints | Mag plots | Spatial mag deviation | Spatial sky 16325A emission deviations (filled: sky, open: star) | Spatial sky continuum emission | Spatial sky telluric CO2 absorption deviations (filled: H < 10) | |||||||||||||||||||||||
| 0 | 0 |
|
|
|
|
|
|
| IPAIR | NAME | SHIFT | NEWSHIFT | S/N | NAME | SHIFT | NEWSHIFT | S/N |
| 0 | 20110024 | 0.512002 | 0.00000 | 18.2170 | 20110023 | 0.0102344 | 0.501768 | 18.2402 |
| 1 | 20110013 | 0.502536 | 0.00946599 | 19.0240 | 20110014 | 0.00811313 | 0.503889 | 19.0117 |
| 2 | 20110012 | 0.503600 | 0.00840199 | 19.0159 | 20110011 | 0.00000 | 0.512002 | 18.9416 |
| 3 | 20110020 | 0.510637 | 0.00136501 | 18.7204 | 20110019 | 0.00923072 | 0.502771 | 18.6956 |
| 4 | 20110025 | 0.511953 | 4.89950e-05 | 18.7181 | 20110026 | 0.0124534 | 0.499549 | 18.6814 |
| 5 | 20110021 | 0.511365 | 0.000636995 | 18.1636 | 20110022 | 0.00882992 | 0.503172 | 18.1968 |
| 6 | 20110017 | 0.511982 | 1.99676e-05 | 18.0292 | 20110018 | 0.0110599 | 0.500942 | 18.0166 |
| 7 | 20110016 | 0.510738 | 0.00126398 | 17.9052 | 20110015 | 0.00982814 | 0.502174 | 17.8746 |