| Red | Green | Blue | |
| z | 17.64 | ||
| znorm | Inf | ||
| sky | -Inf | -Inf | -Inf |
| S/N | 25.3 | 45.8 | 48.5 |
| S/N(c) | 0.0 | 0.0 | 0.0 |
| SN(E/C) |
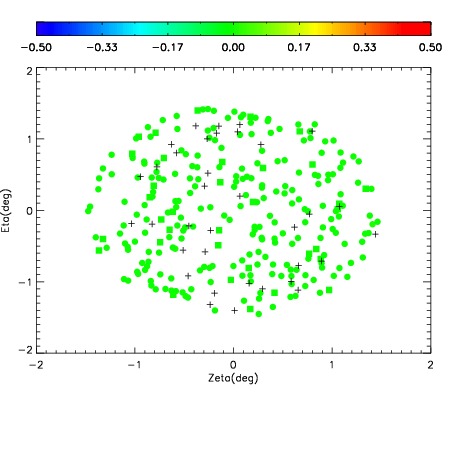
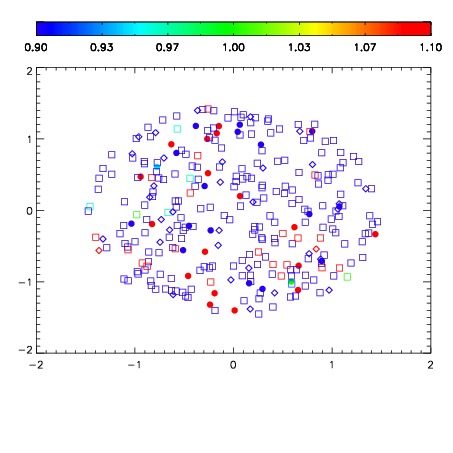
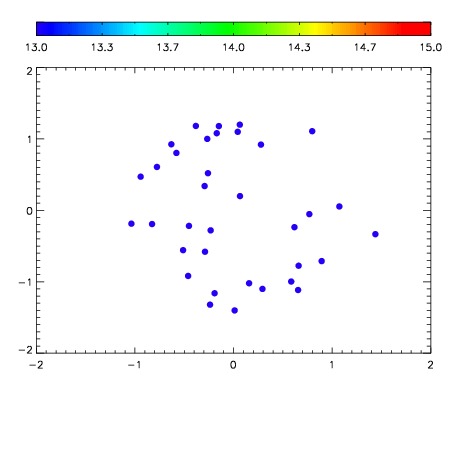

| Frame | Nreads | Zeropoints | Mag plots | Spatial mag deviation | Spatial sky 16325A emission deviations (filled: sky, open: star) | Spatial sky continuum emission | Spatial sky telluric CO2 absorption deviations (filled: H < 10) | |||||||||||||||||||||||
| 0 | 0 |
|
|
|
|
|
|
| IPAIR | NAME | SHIFT | NEWSHIFT | S/N | NAME | SHIFT | NEWSHIFT | S/N |
| 0 | 17150021 | 0.489363 | 0.00000 | 18.3629 | 17150022 | 0.00997866 | 0.479384 | 18.3351 |
| 1 | 17150012 | 0.484654 | 0.00470901 | 18.5231 | 17150011 | 0.00000 | 0.489363 | 18.5785 |
| 2 | 17150020 | 0.487591 | 0.00177202 | 18.4258 | 17150019 | 0.00763167 | 0.481731 | 18.4086 |
| 3 | 17150016 | 0.487951 | 0.00141200 | 18.2305 | 17150014 | 0.00311338 | 0.486250 | 18.2213 |
| 4 | 17150013 | 0.487193 | 0.00217003 | 18.1819 | 17150015 | 0.00440067 | 0.484962 | 17.9305 |
| 5 | 17150017 | 0.488882 | 0.000481009 | 17.7580 | 17150018 | 0.00809473 | 0.481268 | 17.6907 |