| Red | Green | Blue | |
| z | 17.64 | ||
| znorm | Inf | ||
| sky | -Inf | -Inf | -Inf |
| S/N | 32.1 | 53.7 | 57.8 |
| S/N(c) | 0.0 | 0.0 | 0.0 |
| SN(E/C) |
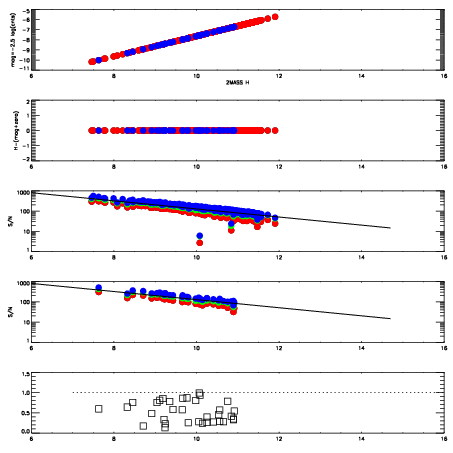
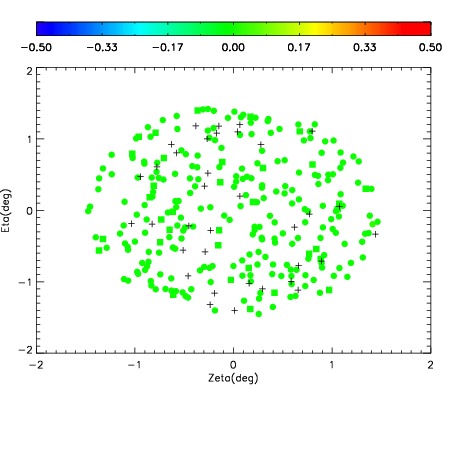
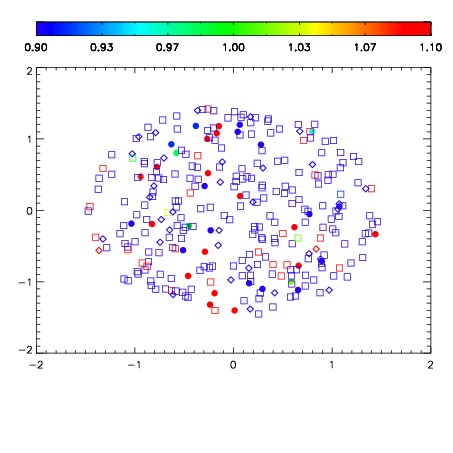
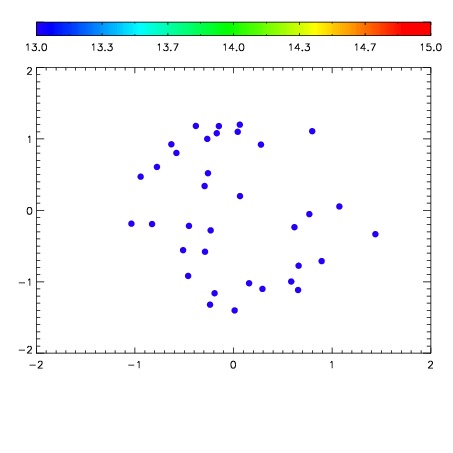

| Frame | Nreads | Zeropoints | Mag plots | Spatial mag deviation | Spatial sky 16325A emission deviations (filled: sky, open: star) | Spatial sky continuum emission | Spatial sky telluric CO2 absorption deviations (filled: H < 10) | |||||||||||||||||||||||
| 0 | 0 |
|
|
|
|
|
|
| IPAIR | NAME | SHIFT | NEWSHIFT | S/N | NAME | SHIFT | NEWSHIFT | S/N |
| 0 | 17160017 | 0.486612 | 0.00000 | 17.9398 | 17160018 | 0.000493203 | 0.486119 | 17.8360 |
| 1 | 17160012 | 0.481231 | 0.00538099 | 19.1287 | 17160014 | -0.00140387 | 0.488016 | 19.1337 |
| 2 | 17160013 | 0.482133 | 0.00447899 | 19.1000 | 17160011 | 0.00000 | 0.486612 | 19.1212 |
| 3 | 17160020 | 0.484100 | 0.00251198 | 18.6481 | 17160019 | -0.000877387 | 0.487489 | 18.6519 |
| 4 | 17160016 | 0.485931 | 0.000680983 | 18.5268 | 17160015 | -0.000362023 | 0.486974 | 18.4991 |