| Red | Green | Blue | |
| z | 17.64 | ||
| znorm | Inf | ||
| sky | -NaN | -NaN | -Inf |
| S/N | 33.5 | 50.9 | 62.9 |
| S/N(c) | 58.9 | 72.1 | 17.0 |
| SN(E/C) |
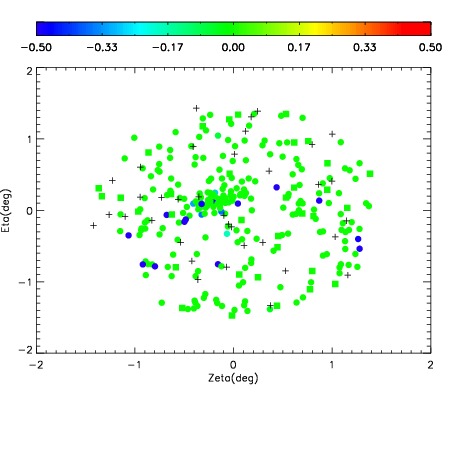
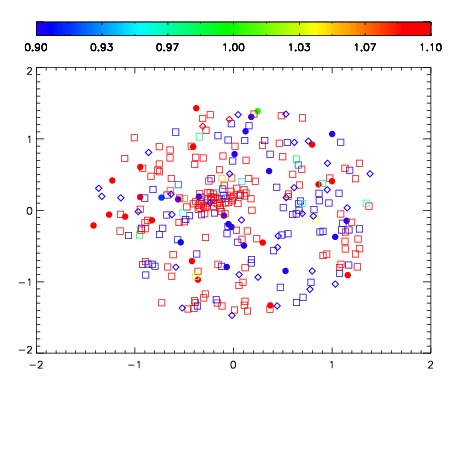
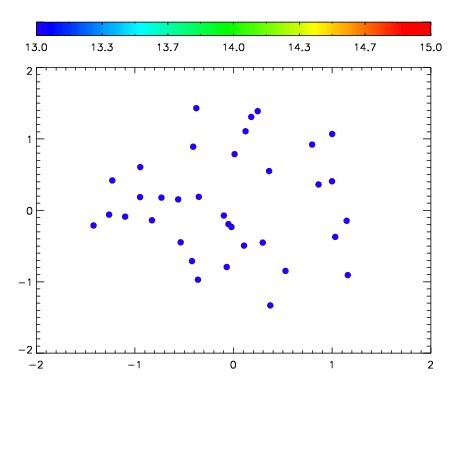

| Frame | Nreads | Zeropoints | Mag plots | Spatial mag deviation | Spatial sky 16325A emission deviations (filled: sky, open: star) | Spatial sky continuum emission | Spatial sky telluric CO2 absorption deviations (filled: H < 10) | |||||||||||||||||||||||
| 0 | 0 |
|
|
|
|
|
|
| IPAIR | NAME | SHIFT | NEWSHIFT | S/N | NAME | SHIFT | NEWSHIFT | S/N |
| 0 | 16110016 | 0.495345 | 0.00000 | 19.1034 | 16110015 | 0.000991076 | 0.494354 | 19.1224 |
| 1 | 16110013 | 0.495242 | 0.000102997 | 19.1355 | 16110011 | 0.00000 | 0.495345 | 19.1402 |
| 2 | 16110012 | 0.494334 | 0.00101098 | 19.1159 | 16110014 | 0.00185381 | 0.493491 | 19.1252 |
| 3 | 16110017 | 0.494808 | 0.000537008 | 19.0986 | 16110018 | 0.000415355 | 0.494930 | 19.0850 |