| Red | Green | Blue | |
| z | 17.64 | ||
| znorm | Inf | ||
| sky | -NaN | -NaN | -NaN |
| S/N | 24.4 | 35.5 | 41.5 |
| S/N(c) | 24.4 | 22.2 | 33.2 |
| SN(E/C) |
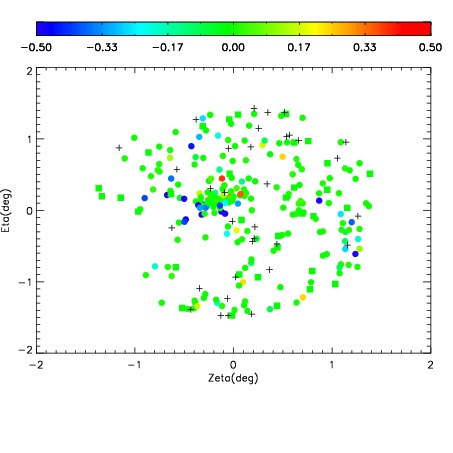
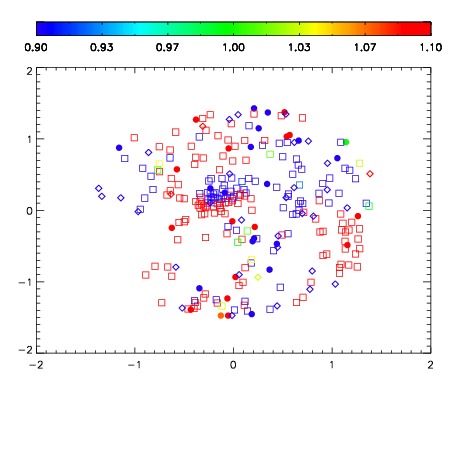
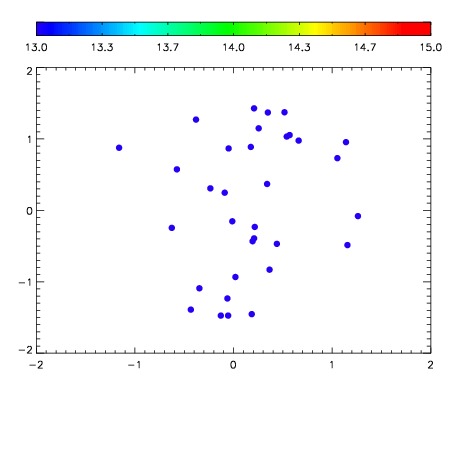

| Frame | Nreads | Zeropoints | Mag plots | Spatial mag deviation | Spatial sky 16325A emission deviations (filled: sky, open: star) | Spatial sky continuum emission | Spatial sky telluric CO2 absorption deviations (filled: H < 10) | |||||||||||||||||||||||
| 0 | 0 |
|
|
|
|
|
|
| IPAIR | NAME | SHIFT | NEWSHIFT | S/N | NAME | SHIFT | NEWSHIFT | S/N |
| 0 | 16160019 | 0.492122 | 0.00000 | 19.2504 | 16160018 | 0.00000 | 0.492122 | 19.2227 |
| 1 | 16160020 | 0.491765 | 0.000357002 | 19.3196 | 16160021 | 0.000801106 | 0.491321 | 19.2907 |