| Red | Green | Blue | |
| z | 17.64 | ||
| znorm | 12.71 | ||
| sky | 20.9 | 21.1 | 22.0 |
| S/N | 23.9 | 35.2 | 41.6 |
| S/N(c) | 48.8 | 43.1 | 30.5 |
| SN(E/C) |
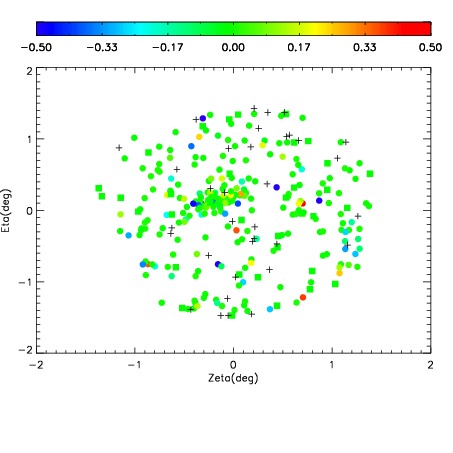
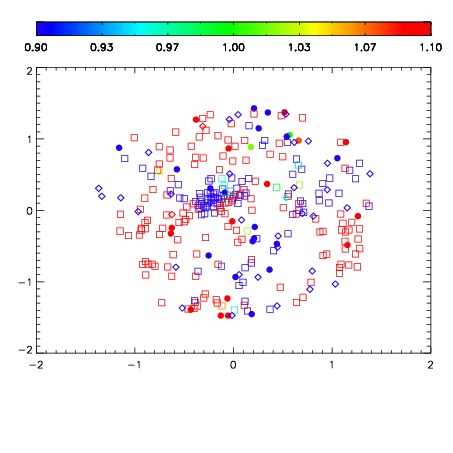
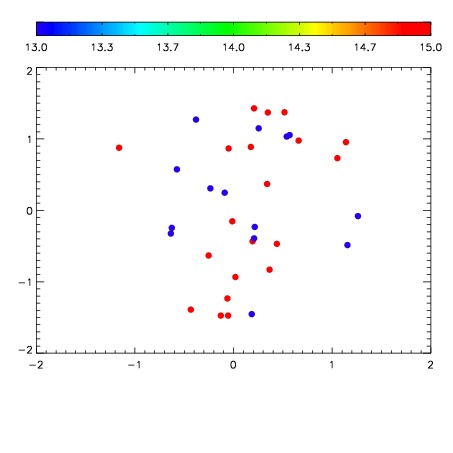

| Frame | Nreads | Zeropoints | Mag plots | Spatial mag deviation | Spatial sky 16325A emission deviations (filled: sky, open: star) | Spatial sky continuum emission | Spatial sky telluric CO2 absorption deviations (filled: H < 10) | |||||||||||||||||||||||
| 0 | 94 |
|
|
|
|
|
|
| IPAIR | NAME | SHIFT | NEWSHIFT | S/N | NAME | SHIFT | NEWSHIFT | S/N |
| 0 | 18830078 | 0.00000 | 0.00000 | 19.9365 | 18830079 | -0.487114 | 0.487114 | 19.8950 |