| Red | Green | Blue | |
| z | 17.65 | ||
| znorm | Inf | ||
| sky | -NaN | -NaN | -NaN |
| S/N | 34.6 | 51.5 | 60.6 |
| S/N(c) | 75.2 | 18.4 | 73.9 |
| SN(E/C) |
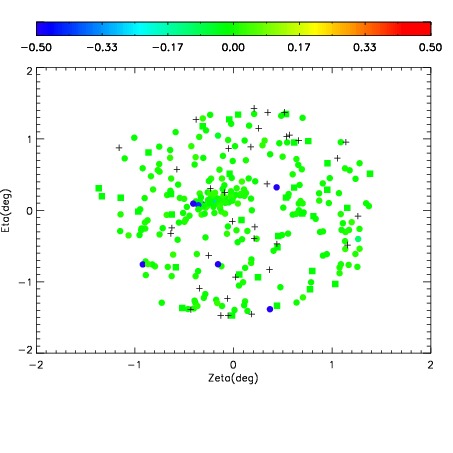
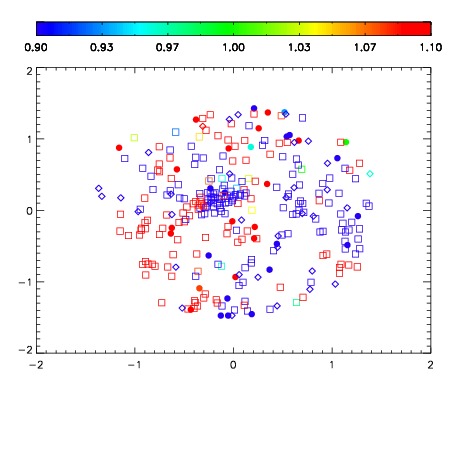
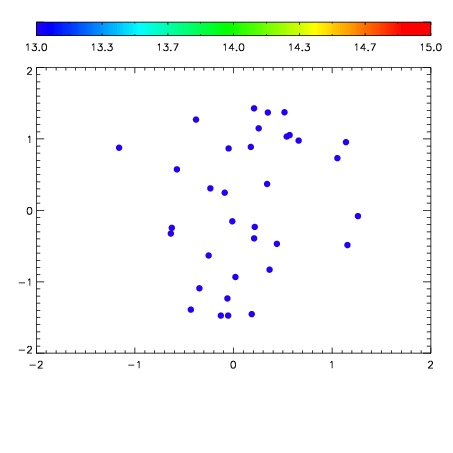

| Frame | Nreads | Zeropoints | Mag plots | Spatial mag deviation | Spatial sky 16325A emission deviations (filled: sky, open: star) | Spatial sky continuum emission | Spatial sky telluric CO2 absorption deviations (filled: H < 10) | |||||||||||||||||||||||
| 0 | 0 |
|
|
|
|
|
|
| IPAIR | NAME | SHIFT | NEWSHIFT | S/N | NAME | SHIFT | NEWSHIFT | S/N |
| 0 | 18870067 | 0.00481008 | 0.00000 | 19.9401 | 18870065 | -0.507124 | 0.511934 | 19.8991 |
| 1 | 18870064 | 0.00000 | 0.00481008 | 19.8679 | 18870066 | -0.506140 | 0.510950 | 19.8790 |