| Red | Green | Blue | |
| z | 17.64 | ||
| znorm | Inf | ||
| sky | -Inf | -Inf | -Inf |
| S/N | 27.2 | 49.8 | 57.7 |
| S/N(c) | 0.0 | 0.0 | 0.0 |
| SN(E/C) |
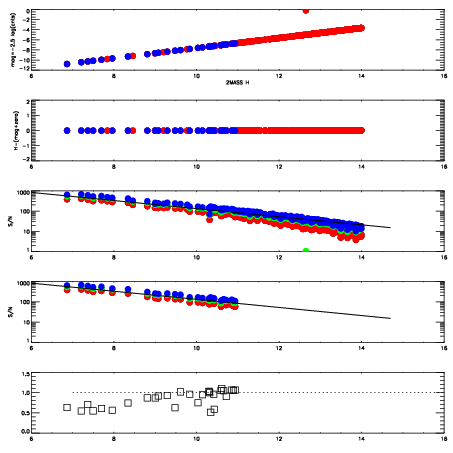
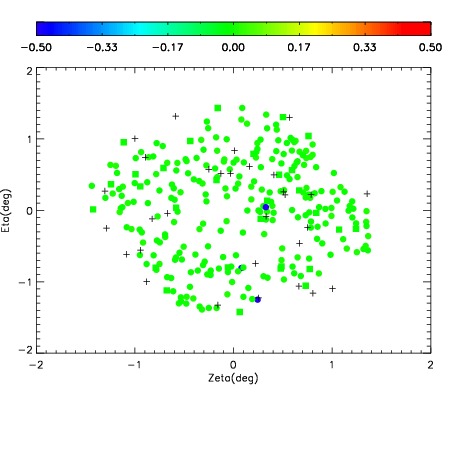
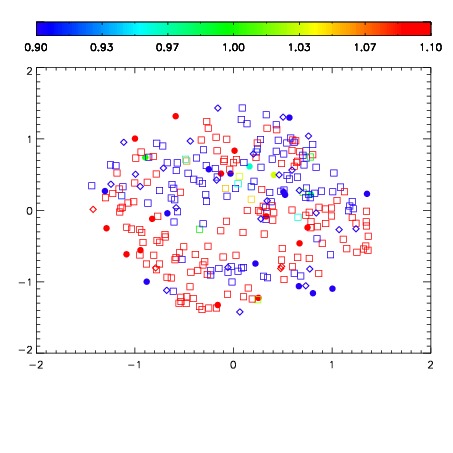


| Frame | Nreads | Zeropoints | Mag plots | Spatial mag deviation | Spatial sky 16325A emission deviations (filled: sky, open: star) | Spatial sky continuum emission | Spatial sky telluric CO2 absorption deviations (filled: H < 10) | |||||||||||||||||||||||
| 0 | 0 |
|
|
|
|
|
|
| IPAIR | NAME | SHIFT | NEWSHIFT | S/N | NAME | SHIFT | NEWSHIFT | S/N |
| 0 | 17570017 | 0.512618 | 0.00000 | 18.9263 | 17570015 | 0.000840008 | 0.511778 | 18.9632 |
| 1 | 17570021 | 0.509075 | 0.00354302 | 19.1365 | 17570020 | 0.00146328 | 0.511155 | 19.1227 |
| 2 | 17570016 | 0.512441 | 0.000177026 | 18.9310 | 17570018 | 0.00231433 | 0.510304 | 19.0651 |
| 3 | 17570012 | 0.510995 | 0.00162303 | 18.7487 | 17570014 | 0.000689186 | 0.511929 | 18.8543 |
| 4 | 17570013 | 0.511408 | 0.00121003 | 18.6908 | 17570011 | 0.00000 | 0.512618 | 18.7955 |