| Red | Green | Blue | |
| z | 17.64 | ||
| znorm | Inf | ||
| sky | -Inf | -NaN | -NaN |
| S/N | 22.3 | 40.2 | 46.5 |
| S/N(c) | 0.0 | 0.0 | 0.0 |
| SN(E/C) |
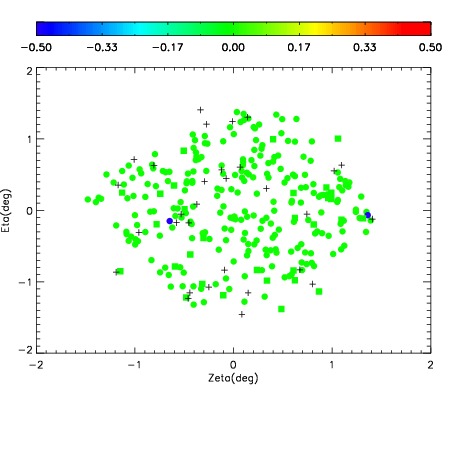
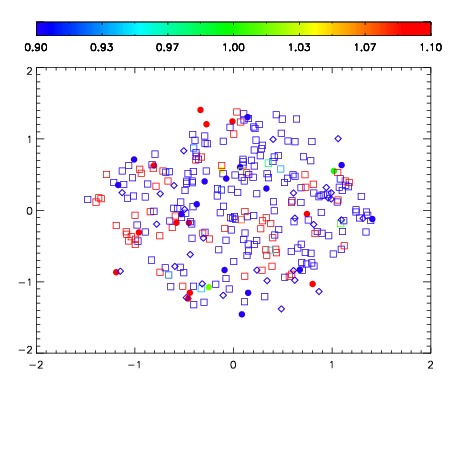
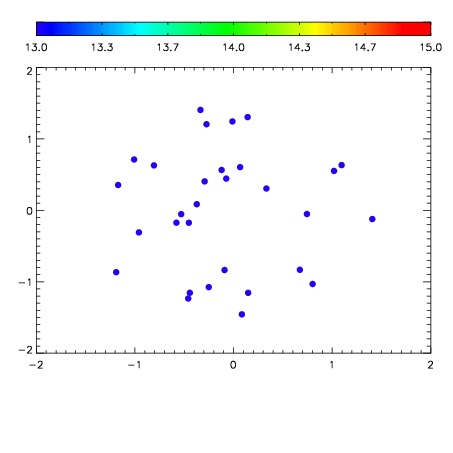

| Frame | Nreads | Zeropoints | Mag plots | Spatial mag deviation | Spatial sky 16325A emission deviations (filled: sky, open: star) | Spatial sky continuum emission | Spatial sky telluric CO2 absorption deviations (filled: H < 10) | |||||||||||||||||||||||
| 0 | 0 |
|
|
|
|
|
|
| IPAIR | NAME | SHIFT | NEWSHIFT | S/N | NAME | SHIFT | NEWSHIFT | S/N |
| 0 | 20000017 | 0.501919 | 0.00000 | 18.7760 | 20000015 | 0.00965838 | 0.492261 | 18.7765 |
| 1 | 20000016 | 0.500901 | 0.00101799 | 18.7885 | 20000011 | 0.00000 | 0.501919 | 18.8763 |
| 2 | 20000012 | 0.500971 | 0.000947952 | 18.7524 | 20000014 | 0.00962340 | 0.492296 | 18.6621 |
| 3 | 20000013 | 0.501685 | 0.000233948 | 18.7230 | 20000018 | 0.00956448 | 0.492354 | 18.5607 |