| Red | Green | Blue | |
| z | 17.64 | ||
| znorm | Inf | ||
| sky | -Inf | -Inf | -Inf |
| S/N | 36.0 | 62.7 | 74.4 |
| S/N(c) | 0.0 | 0.0 | 0.0 |
| SN(E/C) |
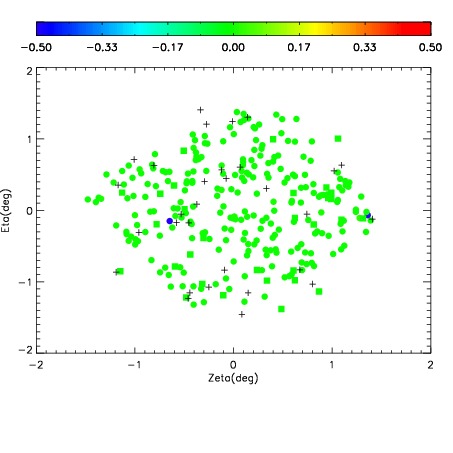
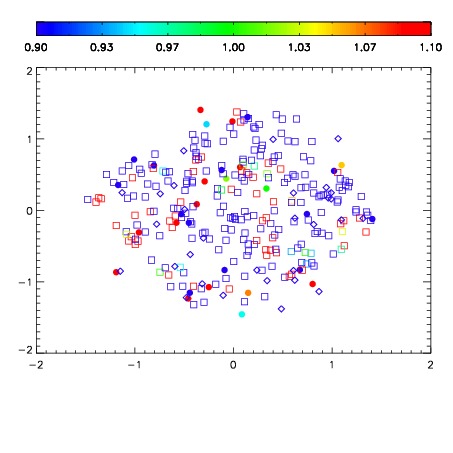
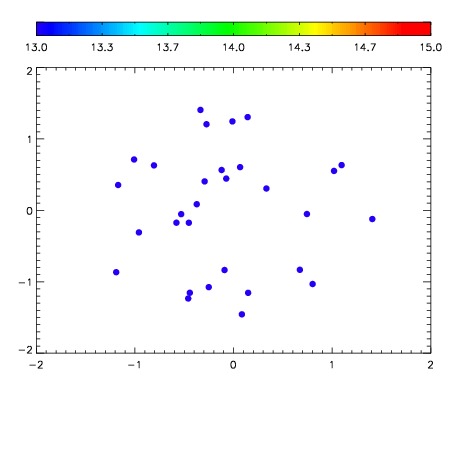

| Frame | Nreads | Zeropoints | Mag plots | Spatial mag deviation | Spatial sky 16325A emission deviations (filled: sky, open: star) | Spatial sky continuum emission | Spatial sky telluric CO2 absorption deviations (filled: H < 10) | |||||||||||||||||||||||
| 0 | 0 |
|
|
|
|
|
|
| IPAIR | NAME | SHIFT | NEWSHIFT | S/N | NAME | SHIFT | NEWSHIFT | S/N |
| 0 | 19650024 | 0.489948 | 0.00000 | 19.0100 | 19650018 | 0.00000 | 0.489948 | 19.0953 |
| 1 | 19650027 | 0.488988 | 0.000959992 | 19.1965 | 19650026 | 0.000269353 | 0.489679 | 19.2158 |
| 2 | 19650028 | 0.489419 | 0.000528991 | 19.1684 | 19650029 | 0.00220235 | 0.487746 | 19.1749 |
| 3 | 19650023 | 0.489739 | 0.000209004 | 19.1619 | 19650022 | -5.95091e-05 | 0.490008 | 19.1370 |
| 4 | 19650020 | 0.489558 | 0.000389993 | 19.1485 | 19650021 | -0.000235768 | 0.490184 | 19.1349 |
| 5 | 19650019 | 0.488764 | 0.00118402 | 19.1411 | 19650025 | 2.50523e-05 | 0.489923 | 19.1160 |