| Red | Green | Blue | |
| z | 17.64 | ||
| znorm | Inf | ||
| sky | -Inf | -Inf | -Inf |
| S/N | 39.7 | 58.1 | 66.1 |
| S/N(c) | 0.0 | 0.0 | 0.0 |
| SN(E/C) |
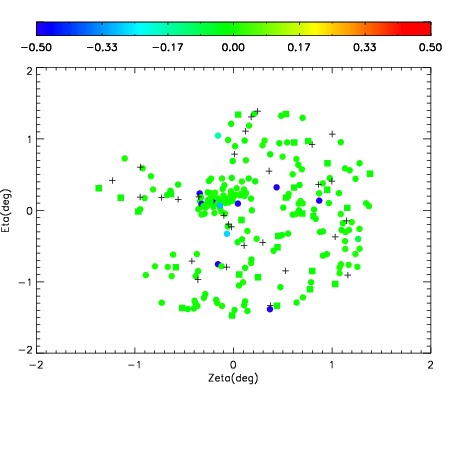
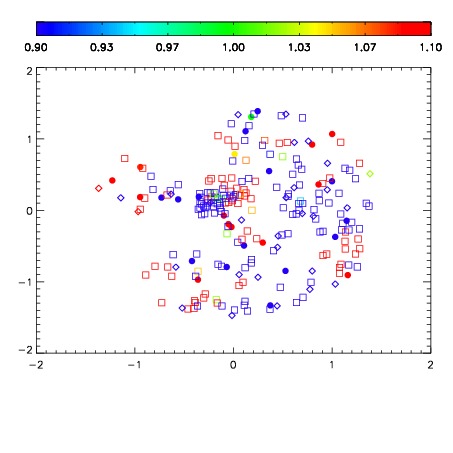
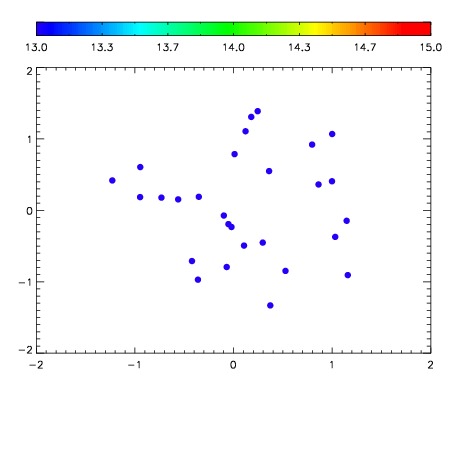

| Frame | Nreads | Zeropoints | Mag plots | Spatial mag deviation | Spatial sky 16325A emission deviations (filled: sky, open: star) | Spatial sky continuum emission | Spatial sky telluric CO2 absorption deviations (filled: H < 10) | |||||||||||||||||||||||
| 0 | 0 |
|
|
|
|
|
|
| IPAIR | NAME | SHIFT | NEWSHIFT | S/N | NAME | SHIFT | NEWSHIFT | S/N |
| 0 | 16430012 | 0.487863 | 0.00000 | 19.8316 | 16430011 | 0.00000 | 0.487863 | 19.8788 |
| 1 | 16430013 | 0.486596 | 0.00126702 | 19.7562 | 16430014 | -0.000554037 | 0.488417 | 19.8155 |