| Red | Green | Blue | |
| z | 17.64 | ||
| znorm | Inf | ||
| sky | -Inf | -NaN | -NaN |
| S/N | 16.9 | 25.0 | 29.7 |
| S/N(c) | 31.2 | 50.7 | 10.8 |
| SN(E/C) |
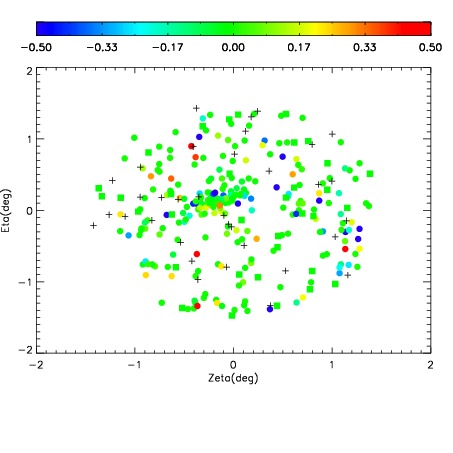
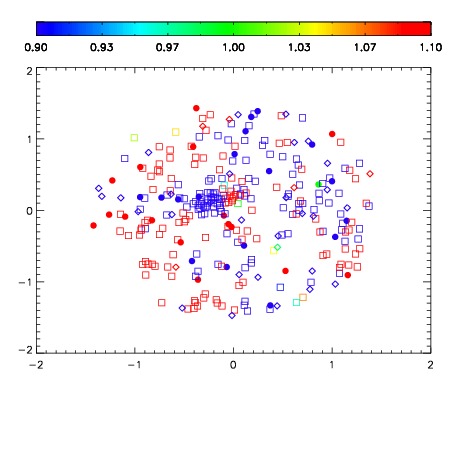
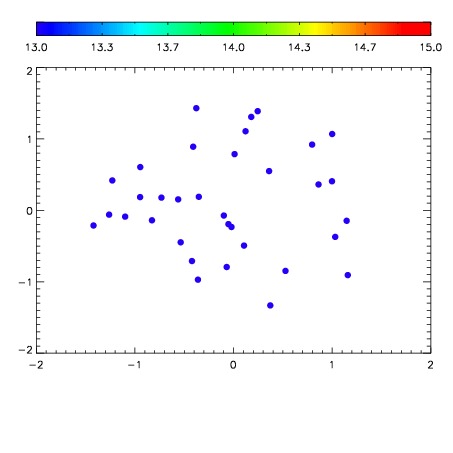

| Frame | Nreads | Zeropoints | Mag plots | Spatial mag deviation | Spatial sky 16325A emission deviations (filled: sky, open: star) | Spatial sky continuum emission | Spatial sky telluric CO2 absorption deviations (filled: H < 10) | |||||||||||||||||||||||
| 0 | 0 |
|
|
|
|
|
|
| IPAIR | NAME | SHIFT | NEWSHIFT | S/N | NAME | SHIFT | NEWSHIFT | S/N |
| 0 | 18790026 | 0.00237257 | 0.00000 | 19.3052 | 18790025 | -0.513703 | 0.516076 | 18.9792 |
| 1 | 18790023 | 0.00000 | 0.00237257 | 18.1141 | 18790024 | -0.511030 | 0.513403 | 17.4444 |