| Frame | Nreads | Zeropoints | Mag plots
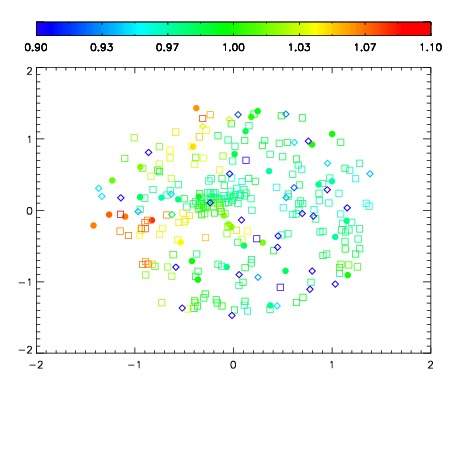
| Spatial mag deviation
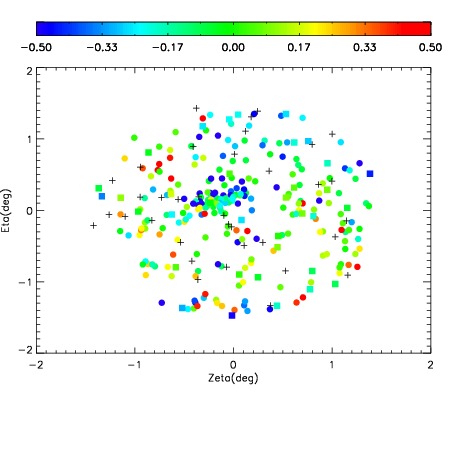
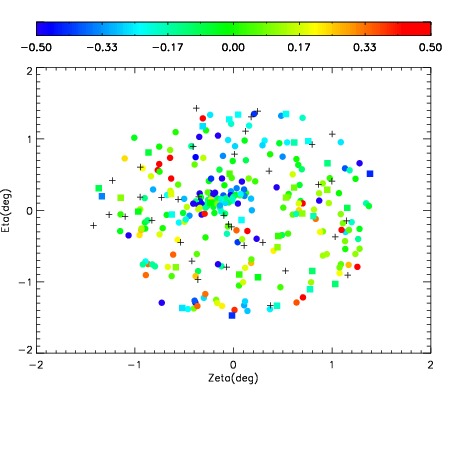
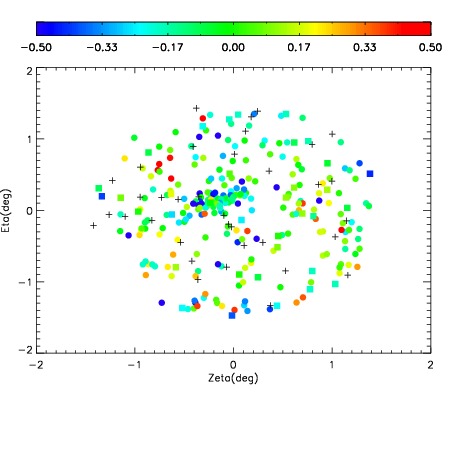
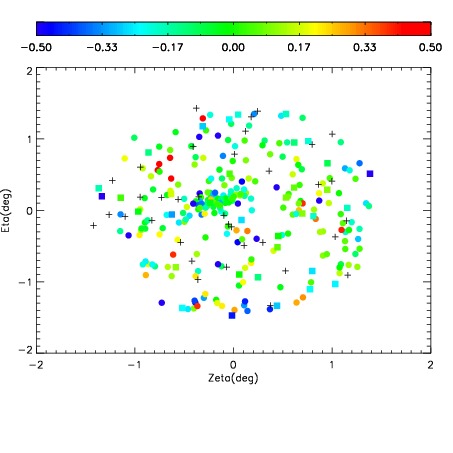
| Spatial sky 16325A emission deviations (filled: sky, open: star)
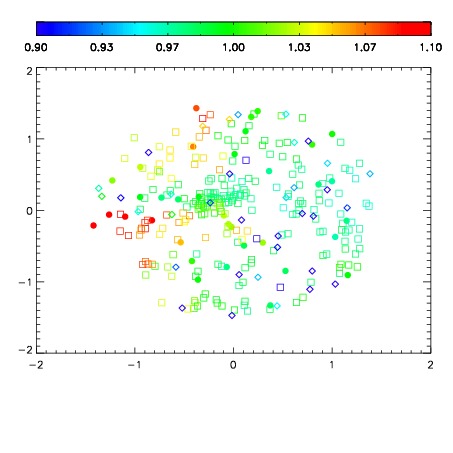
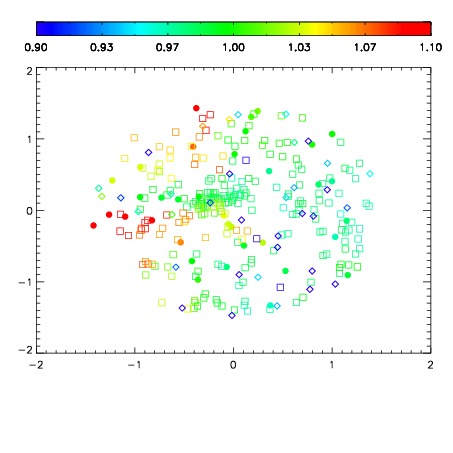
| Spatial sky continuum emission
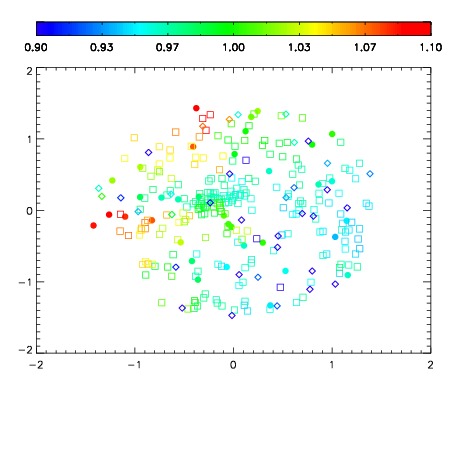
| Spatial sky telluric CO2 absorption deviations (filled: H < 10)
|
| 18850050
| 94
| | Red | Green | Blue
| | z | | 19.71
| | znorm | | 14.77
| | sky | 14.9 | 14.6 | 14.8
| | S/N | 24.9 | 36.4 | 43.1
| | S/N(c) | 43.6 | 49.3 | 12.7
| | SN(E/C) 0.34
|
| 
| 
| 
| 
| 
|
| 18850051
| 94
| | Red | Green | Blue
| | z | | 19.60
| | znorm | | 14.67
| | sky | 15.1 | 14.7 | 14.9
| | S/N | 23.4 | 34.4 | 40.6
| | S/N(c) | 41.0 | 46.5 | 12.0
| | SN(E/C) 0.37
|
| 
| 
| 
| 
| 
|
| 18850052
| 94
| | Red | Green | Blue
| | z | | 19.54
| | znorm | | 14.61
| | sky | 15.2 | 14.8 | 14.8
| | S/N | 22.3 | 32.9 | 38.8
| | S/N(c) | 38.3 | 44.8 | 11.3
| | SN(E/C) 0.38
|
| 
| 
| 
| 
| 
|
| 18850053
| 94
| | Red | Green | Blue
| | z | | 19.65
| | znorm | | 14.72
| | sky | 15.1 | 14.9 | 14.8
| | S/N | 22.9 | 33.9 | 39.9
| | S/N(c) | 38.1 | 45.6 | 11.3
| | SN(E/C) 0.35
|
| 
| 
| 
| 
| 
|