| Red | Green | Blue | |
| z | 17.66 | ||
| znorm | Inf | ||
| sky | -Inf | -Inf | -Inf |
| S/N | 30.5 | 46.5 | 55.3 |
| S/N(c) | 57.0 | 65.6 | 16.8 |
| SN(E/C) |

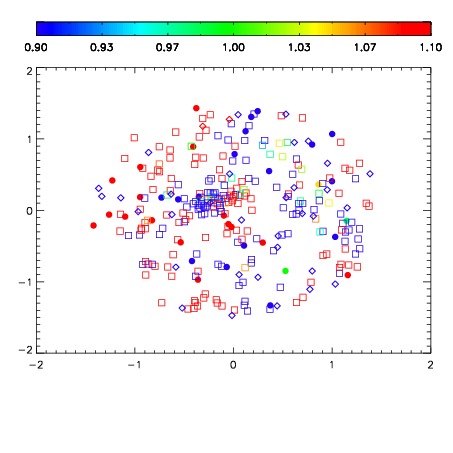
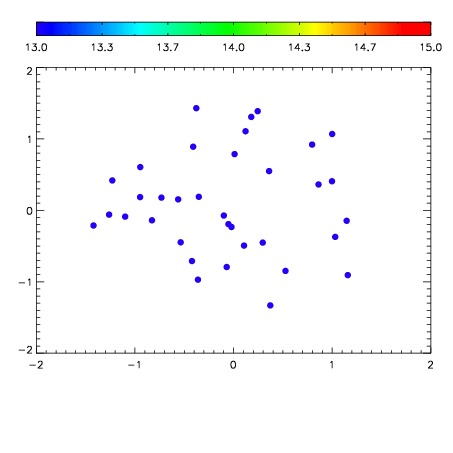

| Frame | Nreads | Zeropoints | Mag plots | Spatial mag deviation | Spatial sky 16325A emission deviations (filled: sky, open: star) | Spatial sky continuum emission | Spatial sky telluric CO2 absorption deviations (filled: H < 10) | |||||||||||||||||||||||
| 0 | 0 |
|
|
|
|
|
|
| IPAIR | NAME | SHIFT | NEWSHIFT | S/N | NAME | SHIFT | NEWSHIFT | S/N |
| 0 | 18850050 | 0.00000 | 0.00000 | 19.7573 | 18850051 | -0.507887 | 0.507887 | 19.6604 |
| 1 | 18850053 | -0.00608762 | 0.00608762 | 19.6849 | 18850052 | -0.508497 | 0.508497 | 19.5809 |