| Red | Green | Blue | |
| z | 17.64 | ||
| znorm | Inf | ||
| sky | -Inf | -Inf | -Inf |
| S/N | 27.9 | 43.4 | 51.4 |
| S/N(c) | 47.9 | 77.2 | 18.9 |
| SN(E/C) |
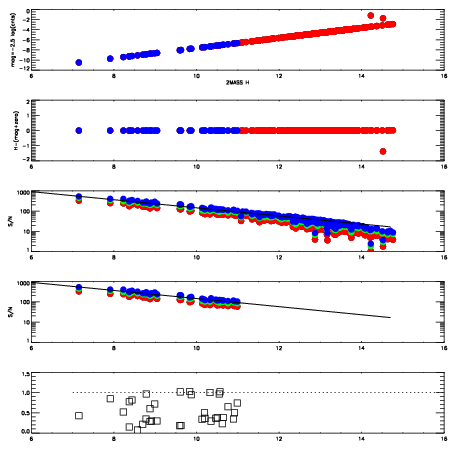
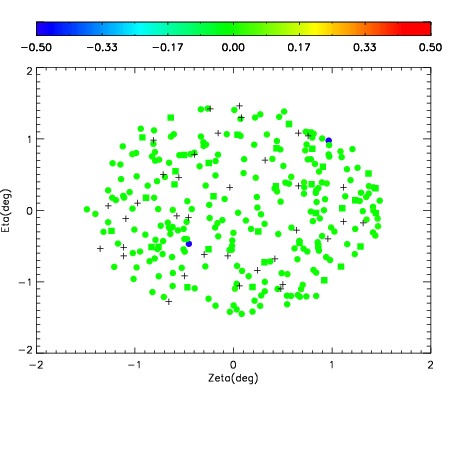
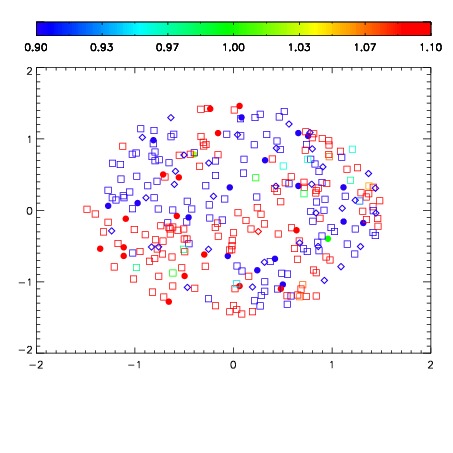
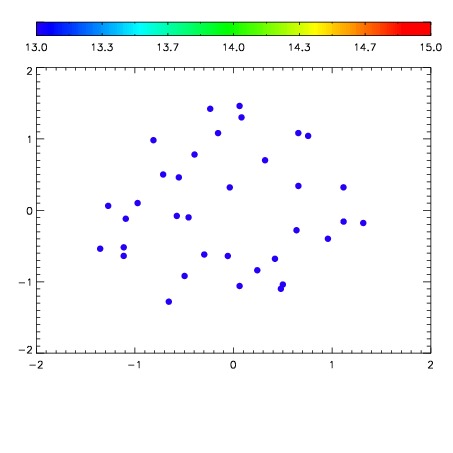

| Frame | Nreads | Zeropoints | Mag plots | Spatial mag deviation | Spatial sky 16325A emission deviations (filled: sky, open: star) | Spatial sky continuum emission | Spatial sky telluric CO2 absorption deviations (filled: H < 10) | |||||||||||||||||||||||
| 0 | 0 |
|
|
|
|
|
|
| IPAIR | NAME | SHIFT | NEWSHIFT | S/N | NAME | SHIFT | NEWSHIFT | S/N |
| 0 | 18800025 | 0.509770 | 0.00000 | 19.3403 | 18800026 | 0.00109085 | 0.508679 | 19.2125 |
| 1 | 18800028 | 0.501486 | 0.00828397 | 19.4501 | 18800027 | 0.000404691 | 0.509365 | 19.2967 |
| 2 | 18800024 | 0.509393 | 0.000376999 | 19.0174 | 18800023 | 0.00000 | 0.509770 | 19.0033 |