| Red | Green | Blue | |
| z | 17.64 | ||
| znorm | Inf | ||
| sky | -Inf | -Inf | -NaN |
| S/N | 35.5 | 52.3 | 61.0 |
| S/N(c) | 55.2 | 91.0 | 51.9 |
| SN(E/C) |
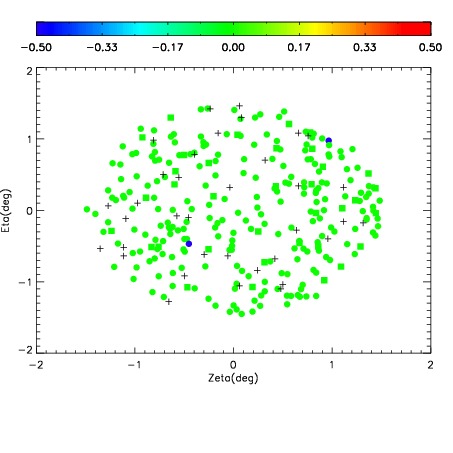
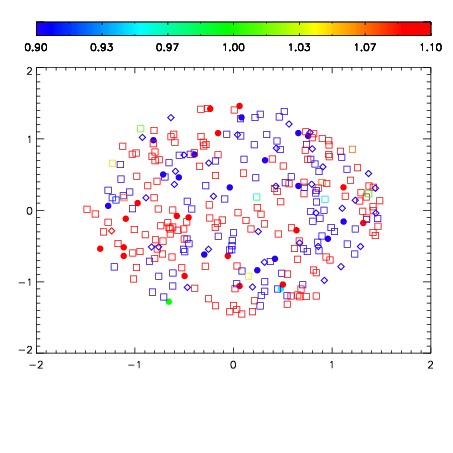
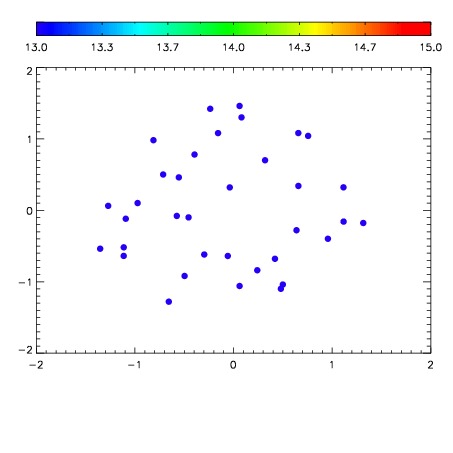

| Frame | Nreads | Zeropoints | Mag plots | Spatial mag deviation | Spatial sky 16325A emission deviations (filled: sky, open: star) | Spatial sky continuum emission | Spatial sky telluric CO2 absorption deviations (filled: H < 10) | |||||||||||||||||||||||
| 0 | 0 |
|
|
|
|
|
|
| IPAIR | NAME | SHIFT | NEWSHIFT | S/N | NAME | SHIFT | NEWSHIFT | S/N |
| 0 | 18830074 | 0.00379990 | 0.00000 | 19.8681 | 18830073 | -0.497246 | 0.501046 | 19.8651 |
| 1 | 18830071 | 0.00000 | 0.00379990 | 19.8071 | 18830072 | -0.498129 | 0.501929 | 19.8157 |