| Red | Green | Blue | |
| z | 17.64 | ||
| znorm | Inf | ||
| sky | -Inf | -Inf | -NaN |
| S/N | 33.5 | 49.0 | 58.5 |
| S/N(c) | 8.3 | 84.5 | 24.6 |
| SN(E/C) |
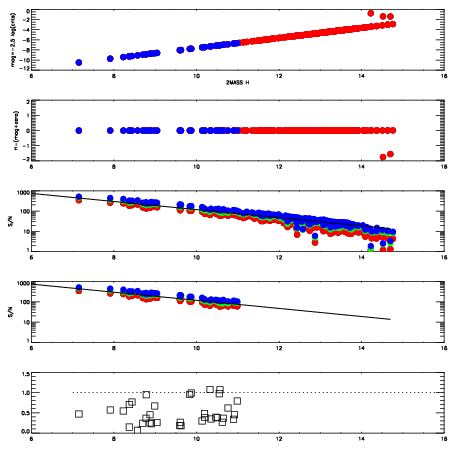
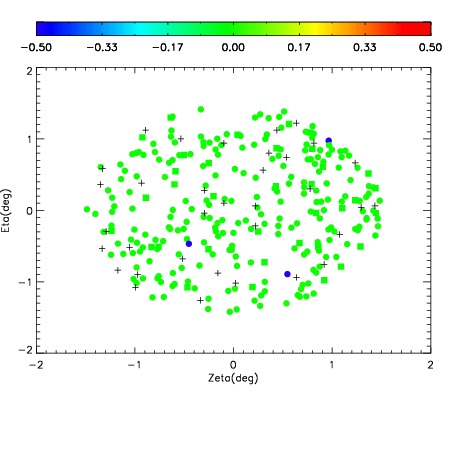
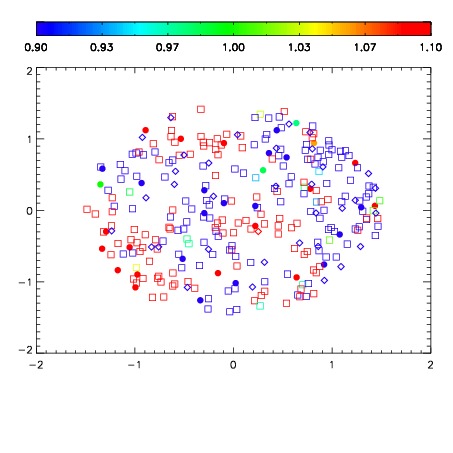
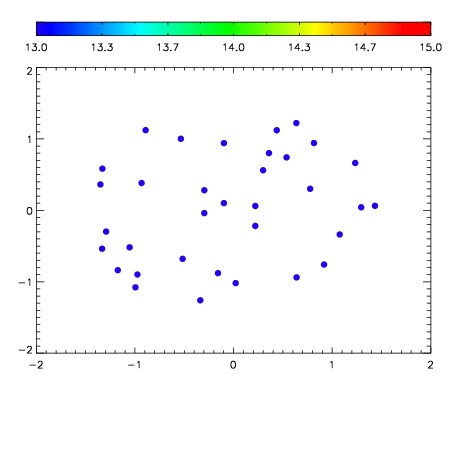

| Frame | Nreads | Zeropoints | Mag plots | Spatial mag deviation | Spatial sky 16325A emission deviations (filled: sky, open: star) | Spatial sky continuum emission | Spatial sky telluric CO2 absorption deviations (filled: H < 10) | |||||||||||||||||||||||
| 0 | 0 |
|
|
|
|
|
|
| IPAIR | NAME | SHIFT | NEWSHIFT | S/N | NAME | SHIFT | NEWSHIFT | S/N |
| 0 | 18810068 | 0.506605 | 0.00000 | 19.6636 | 18810069 | 0.00419405 | 0.502411 | 19.7032 |
| 1 | 18810067 | 0.505890 | 0.000715017 | 19.6479 | 18810066 | 0.00000 | 0.506605 | 19.5952 |