| Red | Green | Blue | |
| z | 17.64 | ||
| znorm | Inf | ||
| sky | -Inf | -Inf | -NaN |
| S/N | 28.3 | 46.1 | 55.8 |
| S/N(c) | 0.0 | 0.0 | 0.0 |
| SN(E/C) |
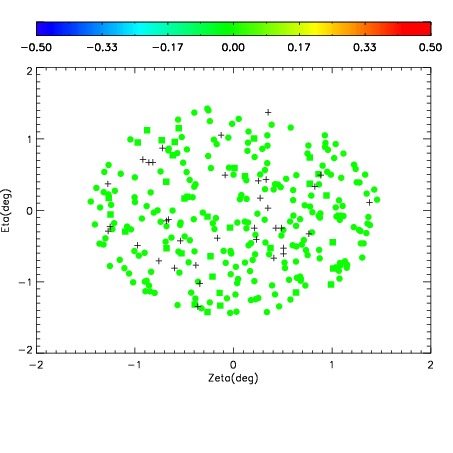
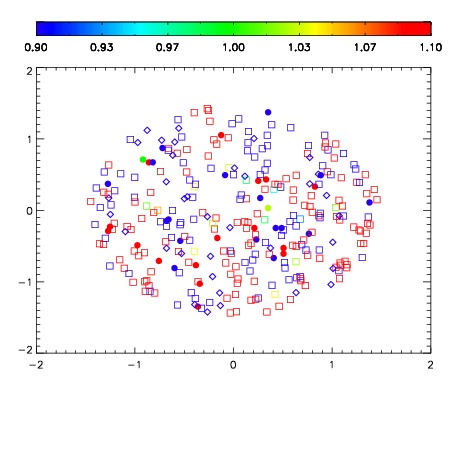
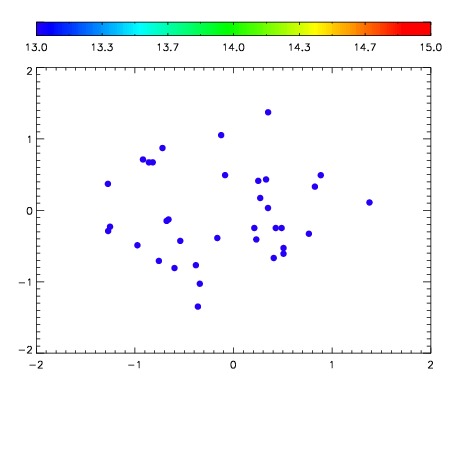

| Frame | Nreads | Zeropoints | Mag plots | Spatial mag deviation | Spatial sky 16325A emission deviations (filled: sky, open: star) | Spatial sky continuum emission | Spatial sky telluric CO2 absorption deviations (filled: H < 10) | |||||||||||||||||||||||
| 0 | 0 |
|
|
|
|
|
|
| IPAIR | NAME | SHIFT | NEWSHIFT | S/N | NAME | SHIFT | NEWSHIFT | S/N |
| 0 | 19720056 | 0.493762 | 0.00000 | 18.9786 | 19720055 | 0.00210177 | 0.491660 | 18.9726 |
| 1 | 19720057 | 0.493726 | 3.60012e-05 | 19.0327 | 19720058 | 0.00464782 | 0.489114 | 19.0316 |
| 2 | 19720048 | 0.490203 | 0.00355899 | 18.8559 | 19720047 | 0.00000 | 0.493762 | 18.9294 |
| 3 | 19720053 | 0.492503 | 0.00125900 | 18.7276 | 19720054 | 0.00260297 | 0.491159 | 18.9218 |
| 4 | 19720049 | 0.490486 | 0.00327599 | 18.6769 | 19720051 | -0.00133702 | 0.495099 | 18.6513 |
| 5 | 19720052 | 0.491628 | 0.00213400 | 18.5967 | 19720050 | -0.00211198 | 0.495874 | 18.5568 |