| Red | Green | Blue | |
| z | 17.64 | ||
| znorm | Inf | ||
| sky | -Inf | -Inf | -NaN |
| S/N | 26.4 | 43.5 | 47.3 |
| S/N(c) | 0.0 | 0.0 | 0.0 |
| SN(E/C) |
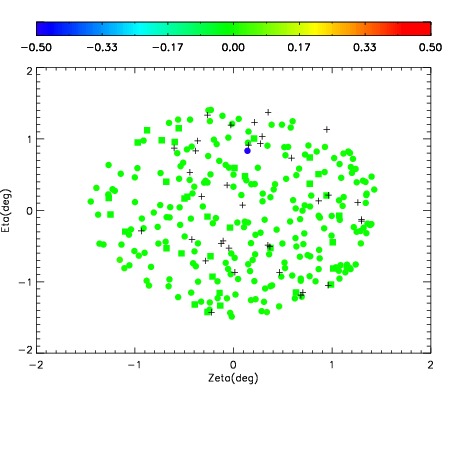
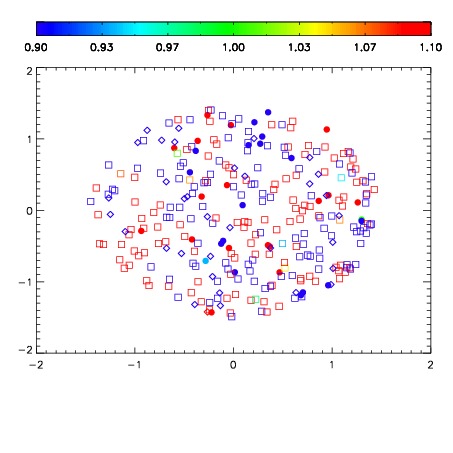


| Frame | Nreads | Zeropoints | Mag plots | Spatial mag deviation | Spatial sky 16325A emission deviations (filled: sky, open: star) | Spatial sky continuum emission | Spatial sky telluric CO2 absorption deviations (filled: H < 10) | |||||||||||||||||||||||
| 0 | 0 |
|
|
|
|
|
|
| IPAIR | NAME | SHIFT | NEWSHIFT | S/N | NAME | SHIFT | NEWSHIFT | S/N |
| 0 | 19740060 | 0.00425740 | 0.00000 | 18.9618 | 19740058 | -0.493034 | 0.497291 | 18.9357 |
| 1 | 19740053 | 0.00000 | 0.00425740 | 18.9786 | 19740054 | -0.491115 | 0.495372 | 18.9529 |
| 2 | 19740056 | 0.00231145 | 0.00194595 | 18.9356 | 19740059 | -0.493012 | 0.497269 | 18.9230 |
| 3 | 19740057 | 0.00368940 | 0.000568000 | 18.9237 | 19740055 | -0.490505 | 0.494762 | 18.9075 |