| Red | Green | Blue | |
| z | 17.64 | ||
| znorm | Inf | ||
| sky | -Inf | -Inf | -NaN |
| S/N | 24.8 | 40.3 | 46.1 |
| S/N(c) | 0.0 | 0.0 | 0.0 |
| SN(E/C) |
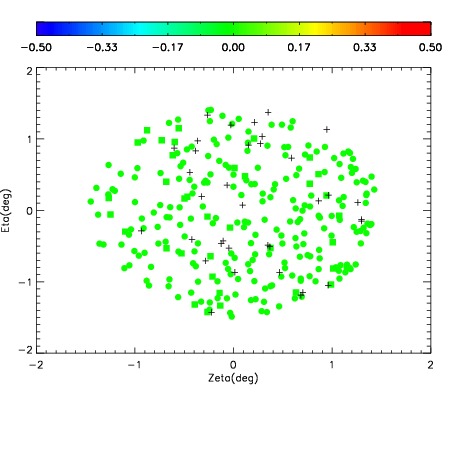
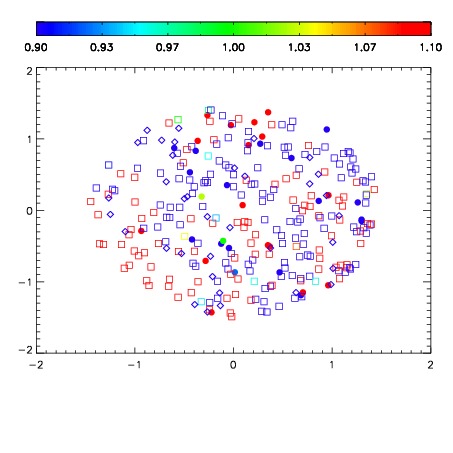


| Frame | Nreads | Zeropoints | Mag plots | Spatial mag deviation | Spatial sky 16325A emission deviations (filled: sky, open: star) | Spatial sky continuum emission | Spatial sky telluric CO2 absorption deviations (filled: H < 10) | |||||||||||||||||||||||
| 0 | 0 |
|
|
|
|
|
|
| IPAIR | NAME | SHIFT | NEWSHIFT | S/N | NAME | SHIFT | NEWSHIFT | S/N |
| 0 | 19950037 | 0.000336158 | 0.00000 | 19.0897 | 19950039 | -0.491527 | 0.491863 | 19.0749 |
| 1 | 19950038 | -0.000677861 | 0.00101402 | 19.0812 | 19950036 | -0.491876 | 0.492212 | 19.0617 |
| 2 | 19950034 | 0.00000 | 0.000336158 | 19.0164 | 19950035 | -0.492963 | 0.493299 | 19.0510 |