| Frame | Nreads | Zeropoints | Mag plots
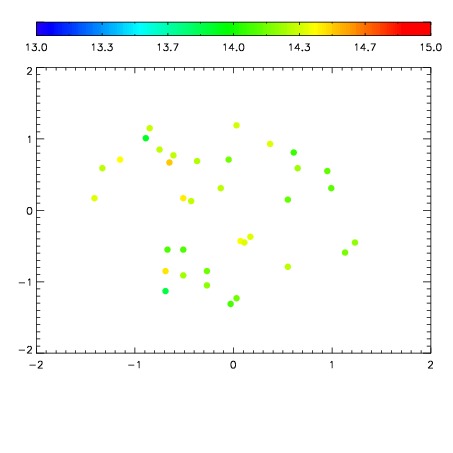
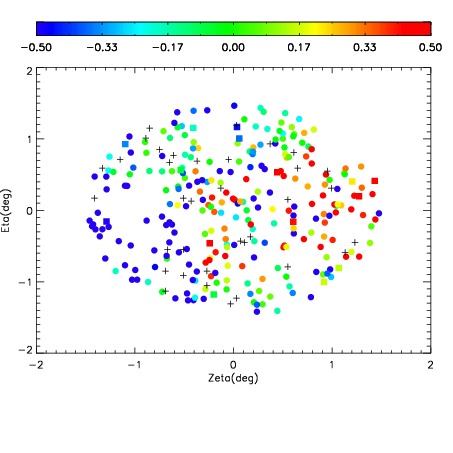
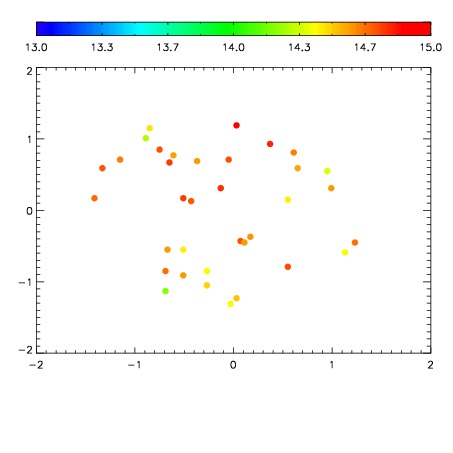
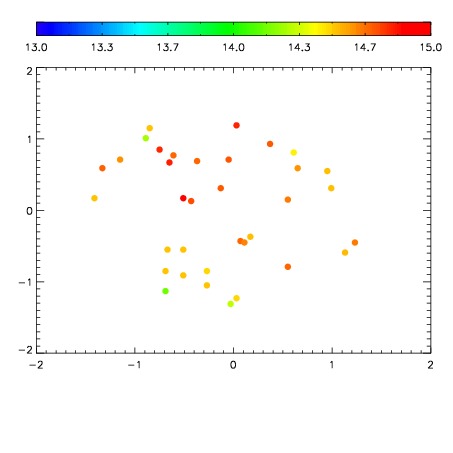
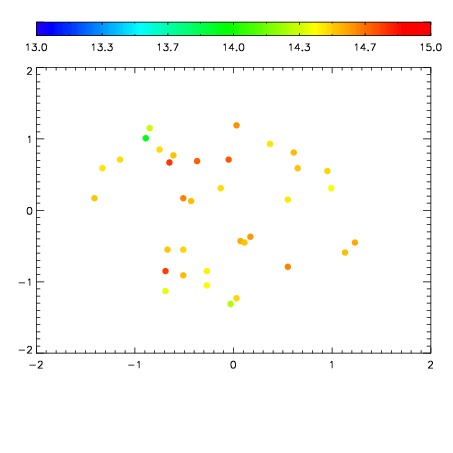
| Spatial mag deviation
| Spatial sky 16325A emission deviations (filled: sky, open: star)
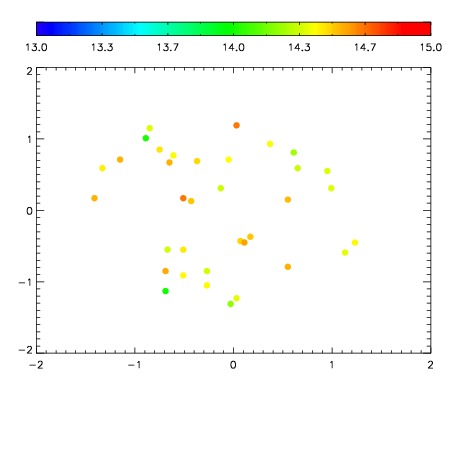
| Spatial sky continuum emission
| Spatial sky telluric CO2 absorption deviations (filled: H < 10)
|
| 17170029
| 42
| | Red | Green | Blue
| | z | | 18.41
| | znorm | | 14.35
| | sky | 14.3 | 14.3 | 14.4
| | S/N | 11.6 | 19.0 | 22.3
| | S/N(c) | 14.7 | 19.4 | 17.2
| | SN(E/C) 0.65
|
| 
| 
| 
| 
| 
|
| 17170030
| 42
| | Red | Green | Blue
| | z | | 18.43
| | znorm | | 14.37
| | sky | 14.6 | 14.4 | 14.6
| | S/N | 11.4 | 18.9 | 21.9
| | S/N(c) | 14.6 | 18.9 | 16.9
| | SN(E/C) 0.67
|
| 
| 
| 
| 
| 
|
| 17170031
| 42
| | Red | Green | Blue
| | z | | 18.26
| | znorm | | 14.20
| | sky | 14.8 | 14.6 | 14.5
| | S/N | 10.6 | 17.7 | 20.4
| | S/N(c) | 14.9 | 19.1 | 16.7
| | SN(E/C) 0.76
|
| 
| 
| 
| 
| 
|
| 17170032
| 42
| | Red | Green | Blue
| | z | | 18.31
| | znorm | | 14.25
| | sky | 14.7 | 14.6 | 14.7
| | S/N | 11.1 | 18.3 | 21.2
| | S/N(c) | 14.9 | 19.1 | 17.3
| | SN(E/C) 0.73
|
| 
| 
| 
| 
| 
|
| 17170033
| 42
| | Red | Green | Blue
| | z | | 18.57
| | znorm | | 14.52
| | sky | 14.7 | 14.5 | 14.6
| | S/N | 11.6 | 19.1 | 22.0
| | S/N(c) | 17.6 | 22.5 | 19.9
| | SN(E/C) 0.72
|
| 
| 
| 
| 
| 
|
| 17170034
| 42
| | Red | Green | Blue
| | z | | 18.54
| | znorm | | 14.48
| | sky | 14.6 | 14.5 | 14.7
| | S/N | 11.1 | 18.6 | 21.6
| | S/N(c) | 17.4 | 22.2 | 19.6
| | SN(E/C) 0.68
|
| 
| 
| 
| 
| 
|