| Red | Green | Blue | |
| z | 17.64 | ||
| znorm | Inf | ||
| sky | -Inf | -Inf | -NaN |
| S/N | 17.8 | 30.9 | 35.6 |
| S/N(c) | 0.0 | 0.0 | 0.0 |
| SN(E/C) |
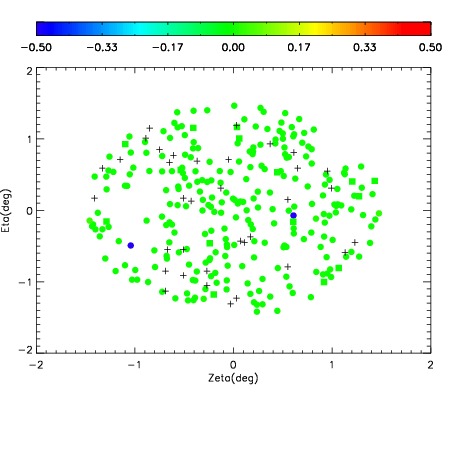
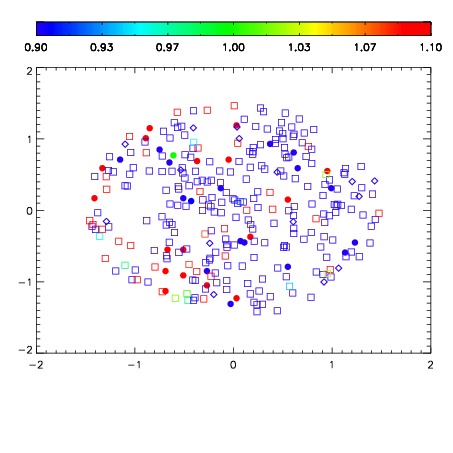


| Frame | Nreads | Zeropoints | Mag plots | Spatial mag deviation | Spatial sky 16325A emission deviations (filled: sky, open: star) | Spatial sky continuum emission | Spatial sky telluric CO2 absorption deviations (filled: H < 10) | |||||||||||||||||||||||
| 0 | 0 |
|
|
|
|
|
|
| IPAIR | NAME | SHIFT | NEWSHIFT | S/N | NAME | SHIFT | NEWSHIFT | S/N |
| 0 | 17170031 | 0.479734 | 0.00000 | 18.1950 | 17170032 | -0.00299166 | 0.482726 | 18.2511 |
| 1 | 17170034 | 0.473246 | 0.00648800 | 18.4472 | 17170033 | -0.00353224 | 0.483266 | 18.4961 |
| 2 | 17170030 | 0.478802 | 0.000932008 | 18.3641 | 17170029 | 0.00000 | 0.479734 | 18.3561 |