| Red | Green | Blue | |
| z | 17.64 | ||
| znorm | Inf | ||
| sky | -Inf | -Inf | -NaN |
| S/N | 22.6 | 39.3 | 45.4 |
| S/N(c) | 0.0 | 0.0 | 0.0 |
| SN(E/C) |
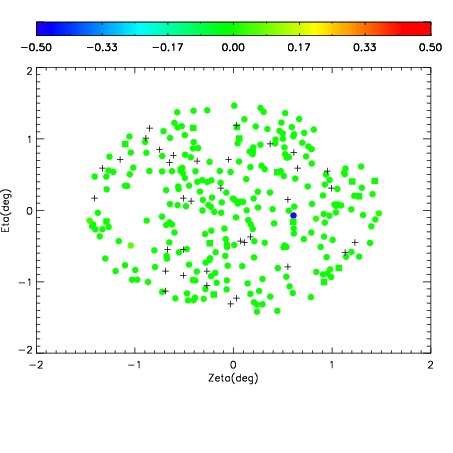
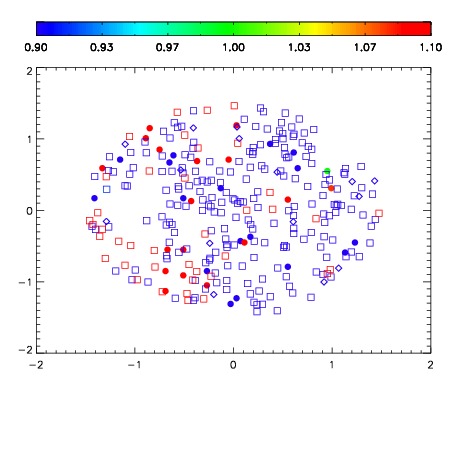
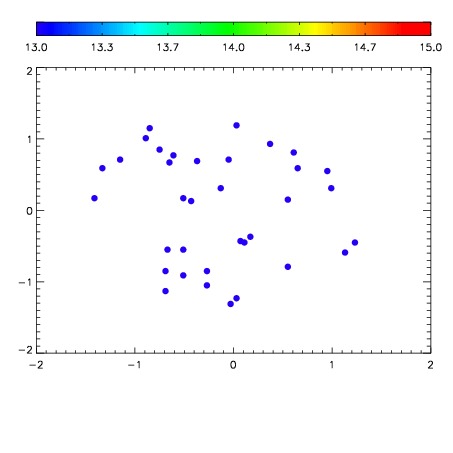

| Frame | Nreads | Zeropoints | Mag plots | Spatial mag deviation | Spatial sky 16325A emission deviations (filled: sky, open: star) | Spatial sky continuum emission | Spatial sky telluric CO2 absorption deviations (filled: H < 10) | |||||||||||||||||||||||
| 0 | 0 |
|
|
|
|
|
|
| IPAIR | NAME | SHIFT | NEWSHIFT | S/N | NAME | SHIFT | NEWSHIFT | S/N |
| 0 | 17190036 | 0.00602653 | 0.00000 | 18.3026 | 17190030 | -0.487354 | 0.493381 | 18.2560 |
| 1 | 17190035 | 0.00442765 | 0.00159888 | 18.6432 | 17190034 | -0.486964 | 0.492991 | 18.5950 |
| 2 | 17190032 | 0.00458072 | 0.00144581 | 18.5125 | 17190033 | -0.487320 | 0.493347 | 18.4532 |
| 3 | 17190028 | 0.00000 | 0.00602653 | 18.4098 | 17190029 | -0.487394 | 0.493421 | 18.3868 |
| 4 | 17190031 | 0.00560306 | 0.000423470 | 18.2719 | 17190037 | -0.483145 | 0.489172 | 15.7805 |