| Red | Green | Blue | |
| z | 17.64 | ||
| znorm | Inf | ||
| sky | -Inf | -Inf | -NaN |
| S/N | 16.5 | 31.1 | 34.8 |
| S/N(c) | 0.0 | 0.0 | 0.0 |
| SN(E/C) |
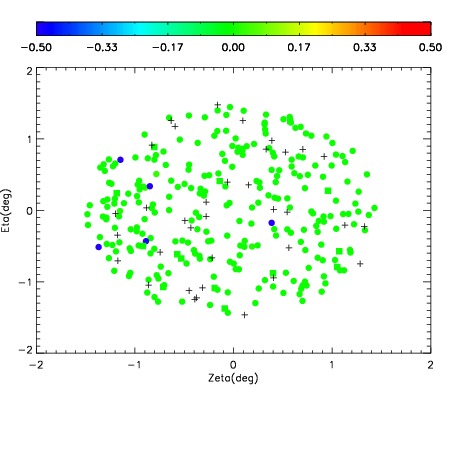

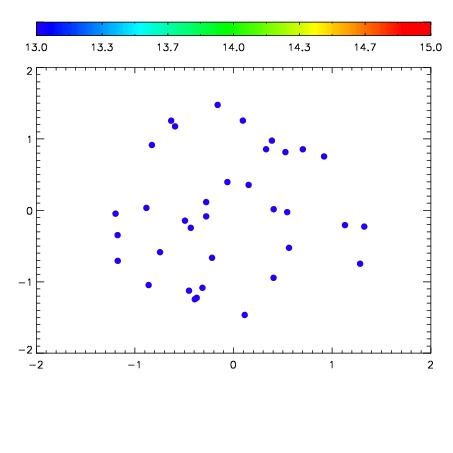

| Frame | Nreads | Zeropoints | Mag plots | Spatial mag deviation | Spatial sky 16325A emission deviations (filled: sky, open: star) | Spatial sky continuum emission | Spatial sky telluric CO2 absorption deviations (filled: H < 10) | |||||||||||||||||||||||
| 0 | 0 |
|
|
|
|
|
|
| IPAIR | NAME | SHIFT | NEWSHIFT | S/N | NAME | SHIFT | NEWSHIFT | S/N |
| 0 | 18150012 | 0.496163 | 0.00000 | 17.9908 | 18150014 | -0.00757590 | 0.503739 | 18.0750 |
| 1 | 18150016 | 0.495972 | 0.000191003 | 18.6116 | 18150018 | -0.00655463 | 0.502718 | 18.6699 |
| 2 | 18150017 | 0.496031 | 0.000132024 | 18.4306 | 18150015 | -0.00773287 | 0.503896 | 18.4901 |
| 3 | 18150013 | 0.495759 | 0.000404000 | 17.7236 | 18150011 | 0.00000 | 0.496163 | 17.9586 |