| Red | Green | Blue | |
| z | 17.64 | ||
| znorm | Inf | ||
| sky | -Inf | -Inf | -NaN |
| S/N | 19.6 | 33.4 | 39.7 |
| S/N(c) | 0.0 | 0.0 | 0.0 |
| SN(E/C) |
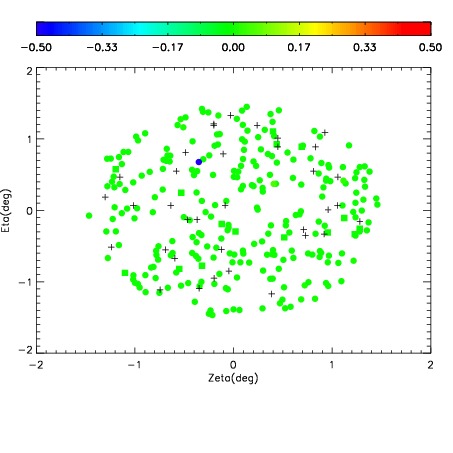
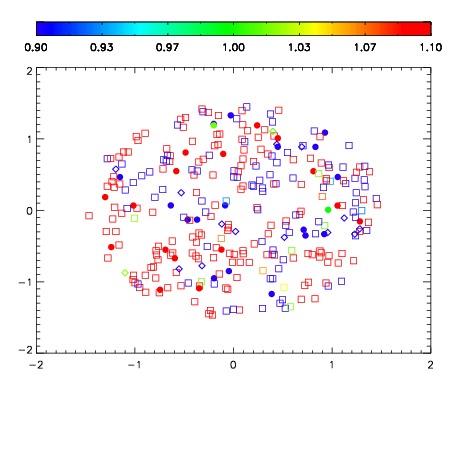
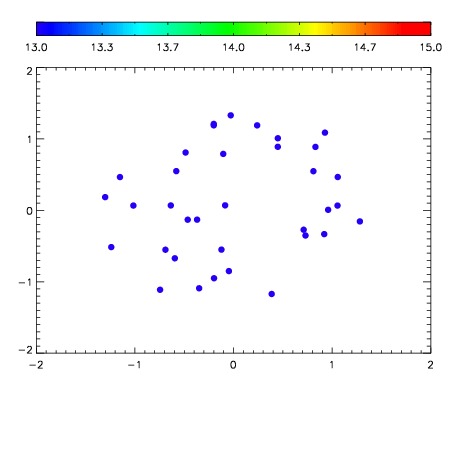

| Frame | Nreads | Zeropoints | Mag plots | Spatial mag deviation | Spatial sky 16325A emission deviations (filled: sky, open: star) | Spatial sky continuum emission | Spatial sky telluric CO2 absorption deviations (filled: H < 10) | |||||||||||||||||||||||
| 0 | 0 |
|
|
|
|
|
|
| IPAIR | NAME | SHIFT | NEWSHIFT | S/N | NAME | SHIFT | NEWSHIFT | S/N |
| 0 | 17610055 | 0.514668 | 0.00000 | 18.4933 | 17610053 | 0.00000 | 0.514668 | 18.4127 |
| 1 | 17610059 | 0.514243 | 0.000424981 | 18.7744 | 17610060 | 0.00221427 | 0.512454 | 18.7681 |
| 2 | 17610058 | 0.513555 | 0.00111300 | 18.6981 | 17610057 | 0.000459844 | 0.514208 | 18.7127 |
| 3 | 17610054 | 0.513277 | 0.00139099 | 18.5374 | 17610056 | 0.000274442 | 0.514394 | 18.5710 |