| Red | Green | Blue | |
| z | 17.64 | ||
| znorm | Inf | ||
| sky | -Inf | -Inf | -NaN |
| S/N | 26.6 | 47.0 | 53.9 |
| S/N(c) | 0.0 | 0.0 | 0.0 |
| SN(E/C) |
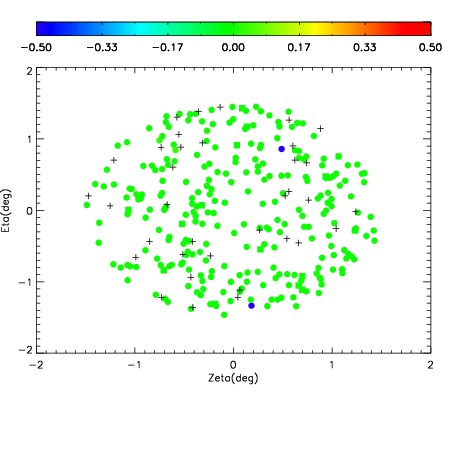
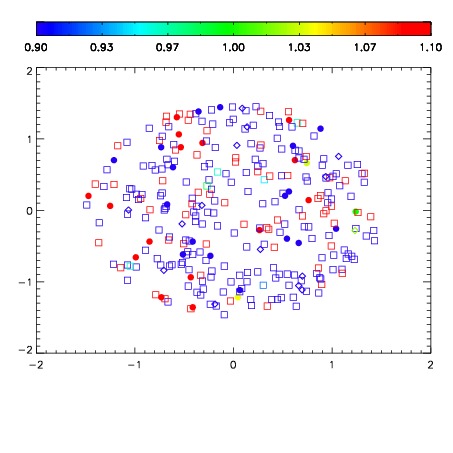


| Frame | Nreads | Zeropoints | Mag plots | Spatial mag deviation | Spatial sky 16325A emission deviations (filled: sky, open: star) | Spatial sky continuum emission | Spatial sky telluric CO2 absorption deviations (filled: H < 10) | |||||||||||||||||||||||
| 0 | 0 |
|
|
|
|
|
|
| IPAIR | NAME | SHIFT | NEWSHIFT | S/N | NAME | SHIFT | NEWSHIFT | S/N |
| 0 | 17650032 | 0.509692 | 0.00000 | 19.0990 | 17650033 | 0.00448270 | 0.505209 | 19.0959 |
| 1 | 17650031 | 0.508470 | 0.00122201 | 19.0664 | 17650030 | 0.00123100 | 0.508461 | 19.0644 |
| 2 | 17650028 | 0.507300 | 0.00239199 | 19.0203 | 17650029 | 0.000597487 | 0.509095 | 19.0364 |
| 3 | 17650027 | 0.506988 | 0.00270402 | 18.9930 | 17650026 | 0.00000 | 0.509692 | 18.9581 |